


Cori Cimpoca · Updated October 2026
In the first two parts of this guide we covered General Market Analysis (part 1/3) and Competitive Analysis (part 2/3). In this final article we turn to the people you are building for: your target audience.
Your target market is the group of customers (people or companies) you plan to serve. Target audience analysis helps you choose the right product, price and message for them.
The guide first appeared in 2017. The October 2026 edition keeps what has stood the test of time: the purchase decision, segmentation, the consumer profile and the NPS score. We have added new examples and sources, extended the sampling section with a part on data quality, added a new section on AI in audience research, and answered frequently asked questions at the end.
Content part 3
In short: how to identify your target audience in 5 steps
A market study for a product answers three questions: how big is the market (part 1), who are the competitors (part 2) and who are the customers (this part). You identify the customers in five steps:
- Start with the decision you need to make. Launching a product, choosing a segment, changing the price? Without a concrete decision, the analysis stays a pile of data.
- Gather what you already know. Existing customers, sales figures and CRM data are an easy starting point.
- Split the audience into segments. A good segment meets four criteria: it is measurable, large enough, profitable, and both reachable and distinct (its needs differ from those of other segments).
- Write the consumer profile from the data you have. A profile is a well-documented hypothesis that you still have to test (see the example).
- Test the profile with a suitable method and a correct sample. Interviews and focus groups for motives; an in-store, online or telephone (CATI) questionnaire and an online panel for numbers. As a benchmark, at 95% confidence a simple random sample of 400 gives a maximum margin of error of about ±4.9%, and 1,000 about ±3.1% (how many respondents you need).
Target audience analysis: what it is and why you do it
Target audience analysis is the process of finding out who your current and potential customers are, what they need and how they come to buy. It helps you choose your target market and work out how to reach it. The decision you have to make determines what you ask and whom you ask. For example, if you are choosing between two segments for a launch, you put the same questions about need and price to both, then compare the answers.
In practice, you know which segment gets your budget, what message to give each one and how to position yourself against competitors. If you want to work with a research team, see what a consumer profiling study looks like.
Target market, target audience and consumer profile: what is the difference
In practice the terms get mixed up, but each one answers a different question:
- Target market: the people or companies you sell to. It answers “who do I sell to?” For example, families with children in large cities.
- Target audience: the people you want to reach with your messages. It can be wider than the target market, because it also includes those who influence or pay for the purchase. It answers “who am I talking to?”
- Consumer profile (buyer persona): a description of a segment as a concrete person, with habits, objections and language. It answers “what does this person look like?”
What you learn from target audience analysis
A good analysis answers at least four questions:
- Why do people buy certain products?
- How do they buy them: online, in a shop, through a distributor?
- How often do they buy?
- In what circumstances do they decide: in a hurry, seasonally, after a recommendation?
The answers depend on how a buyer decides. That is why, before the practical steps, the next three sections show how the customer decides, which stages they go through and what you need to find out about them.
How customers make a purchase decision
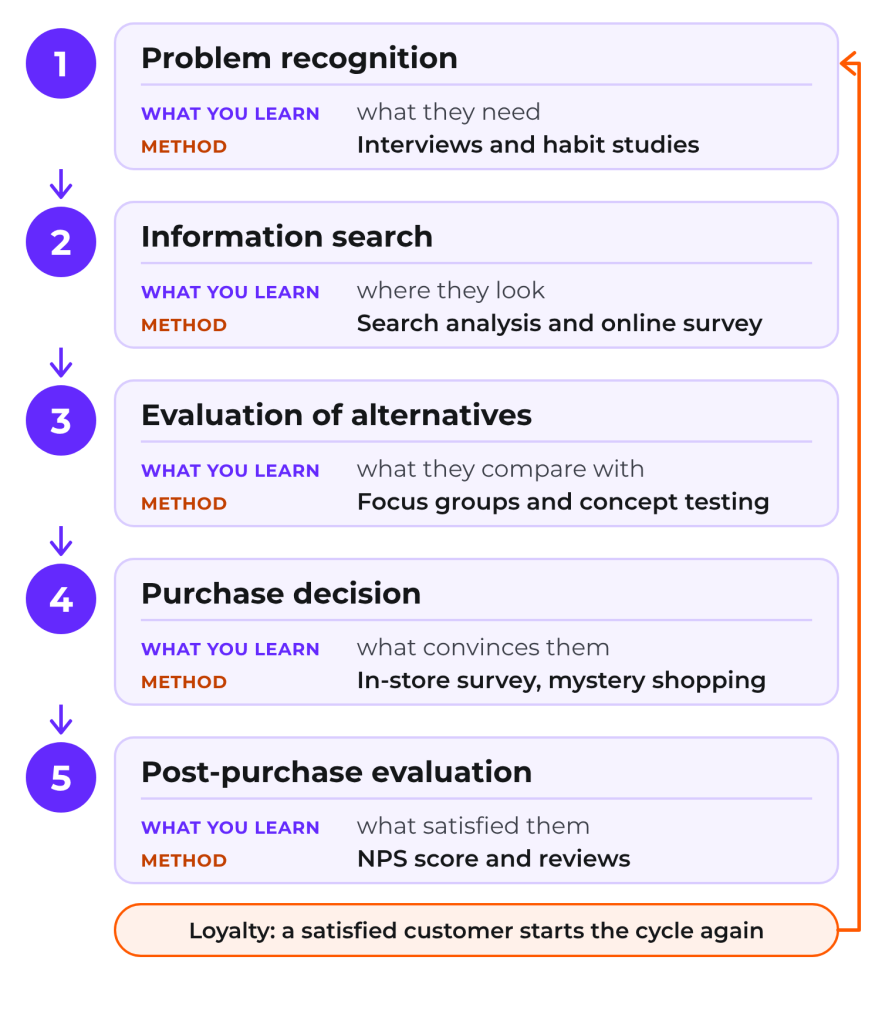
A purchase decision usually goes through five stages: recognising the problem, searching for information, evaluating alternatives, making the decision and post-purchase evaluation. For a soft drink it can take a few seconds, with some stages passing almost unnoticed; for a piece of factory equipment it can take months.
The process has a lot to do with psychology: it is not always conscious or rational. Habit, trust in a familiar name and emotion sometimes weigh more than price.
Picture a pharmacy shelf, with a branded painkiller next to a generic with the same active ingredient at a lower price. Which one would you put in your basket? And what would have to happen for you to change your mind?
The answer differs from one buyer to the next. A consumer analysis shows you what actually decides at the shelf: the price, the name or the pharmacist’s recommendation.
Stages of the purchase process
Each stage answers a different question about the customer and is researched with a different method, as the diagram below shows.
Recognising the problem
It all starts here: the buyer notices a need to satisfy or a problem that calls for a solution. The trigger can come from inside, such as hunger or a headache, or from outside, through advertising, when people discover a need they were not aware of.
How to research it: interviews and usage and attitudes studies.
Searching for information
Once they have identified the problem, the potential customer looks at what solutions are on the market. They may start with a search engine, then move on to marketplaces, reviews and social networks. Some also ask an AI assistant.
How many people use AI varies a lot depending on who you ask. In the AI Adoption Report Romania 2026 (MKOR, August 2026, 1,031 panel respondents aged 18-65), 70% of respondents, people who already answer online surveys, say they use AI. In the general population, Eurostat found in 2025 that 17.8% of Romanians aged 16-74 had used generative AI in the previous three months. The numbers differ because the questions and the populations differ, and neither study measures shopping. Do not assume where your customers search. Ask them, then be present there: strategically placed advertising, useful content and good reviews.
How to research it: search analysis and an online questionnaire.
Evaluating alternatives
The consumer compares what they have found with their own needs and wishes, and with the price. They draw up a mental list of criteria and look for the products that fit it best. If you know what is on that list, you also know how to position yourself against the competition.
How to research it: a focus group and concept testing.
Making the decision
This is where the customer buys. An individual customer looks at value for money. A business customer also weighs payment terms, delivery schedule and trust in the supplier.
How to research it: an in-store questionnaire and mystery shopping.
Post-purchase evaluation
In the last stage, the customer judges what they bought. Did it solve their problem? Did the product live up to expectations? Was it worth the price? Will they buy again? The answers increasingly appear in public, as reviews and recommendations, and repeat purchases and word of mouth depend on them. A satisfied customer starts the cycle again, which is why the diagram has an arrow from the last stage back to the first.
How to research it: the NPS score and reviews, complemented by a satisfaction study.
The stages are the same for everyone, but the people who go through them differ in their needs, their role in the purchase and their profile.
Consumer analysis
Consumer analysis tells you what customers expect, who initiates the purchase and who pays for it, what earns their trust and how to describe them demographically and psychographically. Each answer turns into a decision about your offer, price or message.
What customers need and expect
The first questions are about the motives behind the purchase: what customers look for in your product or service, and whether it solves a problem or fulfils a wish. Here you only note what you want to find out. How to find out in practice, segment by segment, is in the section “Understand their needs”.
Also check:
- whether customers are willing to wait for delivery or want the product immediately, which shapes your production and your go-to-market plan;
- whether they prefer quality or quantity;
- how much they are willing to pay for your offer;
- whether they ask for guarantees.
Attracting customers: who initiates and who buys
How do you attract new customers and make them come back? Start by finding out who wants your product or service. In specialist terms, this person is the initiator of the purchase, and the initiator is not always the buyer or the user.

The gadgets teenagers always want are a good example. They initiate, but someone else pays. The same goes for a kendama, the Japanese ball-and-cup toy: a child asks for it, an adult buys it. Your job is to convince both, and consumer analysis helps you build a marketing strategy that takes both roles into account.

Then check whether your message says clearly which problem the product solves. Your sales and support teams hear every day how customers describe the problem, so start with the words they use.
If you can link the product to an emotion, do it. Loyalty to a brand also depends on what people feel about it, not only on the need it meets.
How to win customer trust and loyalty
Trust is earned with real information about the product. If you have a special ingredient, show what makes it different from what is already on the market. If the product has passed tests, include the results in your marketing materials.
Also offer an incentive that persuades people to try you instead of the brand they are used to, such as an introductory discount. If the product is good, some of them will come back.
Demographic and psychographic characteristics
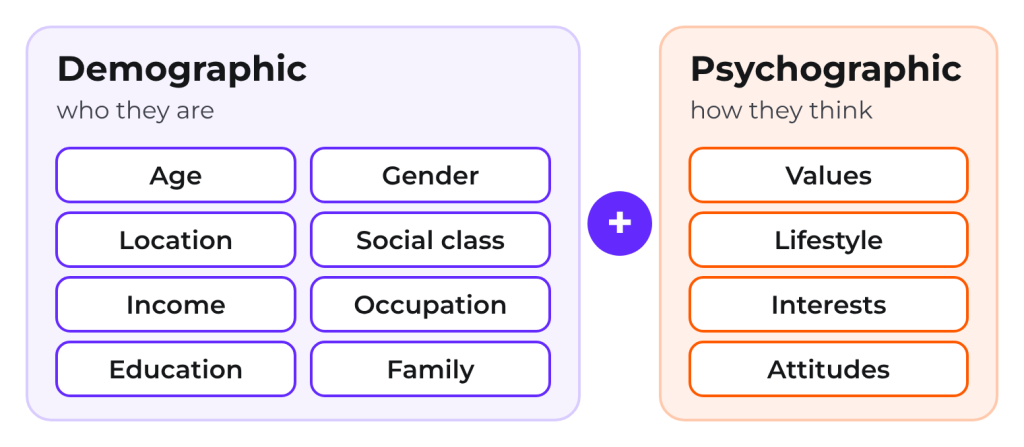
Whether you sell in large stores or through a niche network, you describe customers through two groups of characteristics. The demographic ones tell you who they are: age, gender, geographic area, social class, income, occupation, education and family. The psychographic ones tell you how they think: values, lifestyle, interests and attitudes.
With this information you define the advertising concept and place it where it reaches the right people. Online advertising platforms let you choose your audience by criteria such as age, location or interests, so the better you know your customers, the less budget you waste. An illustrative example: a nappy ad on a gaming channel reaches few parents of babies, however good the ad is.
With the questions from this section ready, go back to steps 2 and 3 of the summary at the top: find out who your customers are and split them into segments.
Identify and segment your audience
You define your audience in two steps: find out who your current and potential customers are, then split them into segments with shared needs. In the next section you write the profile of each segment and find out what it needs.
Identify who you are targeting
Start with the customers you already have. The more details you collect about them, the more clearly you see the groups with common traits and interests. Only then do you look at the people your product has not reached yet. If you are launching a new product and have no customers yet, start with the need it meets and with your competitors’ customers, then test the hypothesis with an online questionnaire or through a panel.
There are several ways to find out who your consumers are, but a mix of methods gives you the picture closest to reality. Also note which other brands your customers buy: that tells you who they compare you with.
A questionnaire gives you their own words, which are partly subjective. You correct for this with sales figures and with CRM (Customer Relationship Management) data, the system where you keep customer records. Use this data in line with GDPR.
At this point you also note, for each group, who uses the product and who pays (see “Attracting customers”). In B2B the roles are split between several people, as you will see below.
Segment your audience
For a precise analysis, you split the identified consumer groups into segments. A good segment meets four criteria:
- Measurable. You can work out the size of the segment, which helps you decide what resources to give it.
- Large enough. It brings enough sales to justify a separate product, price or campaign.
- Profitable. Every new group brings extra costs, so you must be able to cover them.
- Reachable and distinct. You can reach the segment through your channels, and the people in it respond to a different message from the one meant for the other segments.
Illustrative example. An artisan bakery in a large city sees its customers in three segments: office workers from the surrounding buildings, who buy at lunchtime; local families, who come at the weekend; and companies that order catering. The first two segments pass the test easily: you can count them, and the message differs (quick and cheap at lunchtime, traditional at the weekend). Catering needs a van, staff and a schedule, so the “profitable” criterion decides whether it is worth it.
B2B segmentation
Segmentation in business-to-business markets differs from segmentation of end consumers. If you want to go further, read 5 principles in B2B segmentation and how to attract new B2B clients.

The decision-making process
In B2B markets, purchases are decided by a larger, more complex group. In a household, even large purchases are decided by two or three people, and frequent purchases such as food and clothing are made individually. In a company, buying a piece of equipment can involve engineers, procurement specialists, management, the production manager and the health and safety officer, each with their own priorities.
That is why it helps to ask yourself who actually decides in the customer’s company. The person who requests the product, the person who approves it and the person who signs off the payment are not necessarily the same. Do you segment the companies where the decision-makers work, or the decision-makers directly? The answer depends on the product, but the question has to be asked from the start.
Desire or need
B2B buyers are probably more rational than consumers, although this is debated. A consumer may pay 3,000 lei (about EUR 600) for a leather jacket that is less durable than one costing 300 lei (about EUR 60), but would they make the same choice at work? Consumers tend to buy what they want, and B2B customers what they need.
Needs-based segmentation is easier here, so it is worth starting with it. Needs can sometimes be inferred from company size, purchase volume or type of activity.
Products and services adapted to customers
In B2B, products are often made to order. Consumers choose even complicated products, such as cars, by simple criteria. In B2B, even simple products have to be integrated into a larger system, which brings experts into the buying process.
Can you segment, then? Yes: a few key customers are so important that they become segments in their own right, with a dedicated account manager, and the remaining companies are grouped into segments by similar requirements.
A smaller audience
The B2B audience is smaller. A few customers can dominate a company’s sales, whereas in B2C you sell to tens of thousands or millions of people. A company cannot cover the needs of too many segments, so the choice matters more.
Direct relationships and higher loyalty
With a small customer base, a personal relationship is easier to keep: sales and technical representatives can visit every customer, and loyalty is sometimes measured in years. All customers want personal attention, but not all are willing to pay for it, so the supplier decides who gets it, depending on how much each company brings in.
You find out what each customer expects from the relationship by asking them, through interviews or a short questionnaire. As a rule, large customers get frequent face-to-face visits, and the others get periodic calls or messages.
Create the consumer profile
For each segment you write a persona sheet: who they are, what worries them, what objections they have and how they speak, so that you can write messages they will read. You start with the data you already have and with the segmentation, because it is easier to address people than abstract ideas. The profile remains a hypothesis until you test it with the methods in the next section.
A persona is a half-fictional, half-real representation: it combines a projection of the ideal customer with the information collected about the customers you already have.
What a consumer profile contains
You can copy the list below as a template for each persona:
- Background and responsibilities: education, job title, the field they work in and their main responsibilities.
- Demographics: age, gender, income, family and geographic area.
- Communication: which channels they prefer.
- Media and influencers: which publications they read and which content creators they follow.
- Challenges: what problems they face at work or in daily life and how your product can help.
- Objections: what reasons they might have to reject your offer.
- Language: which words and what tone they use, so that your message sounds natural to them.
- Quotes: a few words from consumers, to remind you how real people talk.
An AI assistant can help you fill in the template, but without real data you get a generic portrait that fits anyone (details in AI-generated profiles).
Understand their needs
For each segment you find out which problem it wants to solve, and every department then knows what to do: product, sales, communication. You have five sources at hand:
- Ask them directly. An online questionnaire is an effective and inexpensive method, and online survey platforms help you build and distribute it.
- Look at the history of long-standing customers: how many have already bought a similar product.
- Read what people say in public: Google reviews, comments on your products and your competitors’ products, forums and the related questions that search engines show.
- In B2B, study job postings. They tell you which problems the company is trying to solve.
- Join professional groups on LinkedIn to see what concerns them.
After the research, you link the needs you identified to what your company offers. Solving a problem consumers struggle with every day matters more than a feature that only catches the eye, so think about how you can make their lives easier.
Customer profile example: from data to persona
The MKOR Ethical Consumer 2024 study surveyed 1,000 people from the MKOR panel, aged 18 to 55, through an online questionnaire (fieldwork: November 2023). The study describes the sample as representative by gender, age and region, but with an online panel the results remain indicative for the general population. From the data:
- 38% of respondents consider the environmental impact when they buy, 56% are mostly undecided and 3% are not interested (percentages as published by the study; they do not add up to 100%).
- The demographic portrait of the ethical consumer: more likely a woman, from the Millennial generation, with children under 18, on a middle or low income and with higher education.
- The most frequent actions are cheap and simple: 70% avoid food waste, 64% recycle, 49% walk, cycle or use a scooter.
- Obstacles to sustainable products: higher prices, distrust of eco labels and low availability in shops.
Illustrative persona (built from the study’s data; name and age are indicative):
- Ioana, 34. Mother of two young children, middle income, higher education.
- Challenge: she wants to buy responsibly, but the family budget is limited.
- Objections: she does not trust “eco” labels and cannot always find the products in her neighbourhood shop.
- Fitting message: concrete savings and verifiable proof.
The study does not tell us, however, which publications Ioana reads, which channels she prefers and what language convinces her. For the media, channels and language on the profile sheet you need qualitative research, for example interviews or focus groups.
How to collect the qualitative and quantitative data you need is covered in the next section.
Collect the data: which method to choose
You choose the method by the question: interviews and focus groups tell you why people choose a product, while questionnaires and a panel give you numbers across a wider audience. For the consumer profile you need both: quantitative data (figures, percentages) and qualitative data (motives, words, examples).
Before you pay for new data, go back to what you gathered in step 2, “Identify who you are targeting”, and add the questions your support team gets: this is information about real people, with no collection cost. For the rest, choose one of the methods below or a combination.
Which method suits you
- Interviews and focus groups: you have a hypothesis to explore or an idea to test and want to know why people think the way they do. You work with few people, so you cannot generalise the percentages.
- In-store questionnaire: you want quick feedback from people who already buy, at the moment of purchase.
- Online questionnaire: you need percentages and comparisons between segments, including from people who do not know you yet.
- Telephone questionnaire (CATI): you are looking for decision-makers in companies or people who are hard to reach online. Every interview takes operator time.
- Online panel: you want a controlled sample of people who are already recruited and verified, in a short time. The results describe the panel members, and generalising requires quotas and weighting (details in the panel section).
Interviews and focus groups
What you find out and how: an interview is held with one person, a focus group with a small group, but both help you understand in depth what people think. You can use them to examine problems you have spotted (some respondents think prices are high) or simply to test a new idea (a new promotional campaign).
Advantages: you get what you need to know directly from your customers. The discussions can be recorded, and then you can pay attention to tone of voice, body language and other details.
Disadvantages: they need a budget, especially for the incentives given to participants. They need time and concentration, and possibly an experienced moderator.
Where: in a quiet room or online, by video call, anywhere you can talk for an hour without interruption.
How: calmly, open to criticism, attentive to detail, with prepared questions. At the end, thank participants and explain what you will do with what they told you.
In-store questionnaire
What you find out and how: one question you must include is “How did you hear about us?” The answer shows which of your marketing and communication channels brings you customers. Then come the questions for the socio-demographic profile (age, gender, location, education, income) and for everything else you are interested in, such as preferences, consumption habits or media consumption. Order the questions like a funnel, from general to specific, so you do not confuse respondents.
Advantages: the answers come straight from your customers. It is a quick way to get feedback.
Disadvantages: you cannot ask more than 10-12 questions, because the person came to shop, not to give an opinion. The sample is small, so the answers cannot be generalised, but you can build a larger online questionnaire on them.
How: printed on letterhead paper or directly online, on a tablet, accompanied by the shop assistant’s friendly request and, if possible, a small personalised gift.

Online questionnaire
What you find out and how: the question above becomes “Have you heard of us?”, and only if the answer is “Yes” do you ask where from. The funnel model applies here too, except that there can be more questions and you can branch them (if yes, go to question X).
Advantages: you receive the results directly in electronic format, so you can interpret them immediately, and you can get a sample close to your audience if you use quotas and weighting (see “Quotas and weighting”).
Disadvantages: it takes longer than the in-store questionnaire to collect all the answers you need. You need to do some reading or ask someone more experienced to choose the sample and the distribution channels you use to promote the questionnaire. Work out the number of respondents in advance; see “How many respondents you need”.
Where: you can use specialised platforms, free or paid, for example Google Forms. Free platforms usually give you a basic summary of the data; if you know your way around Excel or SPSS, you can get much more out of the exported data. Check beforehand which functions are in the free version and which require a subscription (for example, question branching).
How: do not post the questionnaire just anywhere and hope that enough people will answer. Choose distribution channels to suit your audience and offer an incentive, for example a discount voucher sent by email. If you do not have your own contact base, you can reach the right sample through an online panel. For simple wording rules, read “3 tips for creating an opinion poll”.
Telephone questionnaire (CATI)
CATI stands for Computer-Assisted Telephone Interviewing. An operator calls the respondent, reads the questions from a screen and enters the answers directly into the database.
The operator can clarify a question that was not understood, and you control who answers, which matters for decision-makers in companies. Phone numbers must be obtained lawfully. If your audience answers easily online, an online questionnaire is usually the simpler option.
Online panel: when you need people who are not your customers yet
An online panel is a community of people who have signed up to answer studies. Through it you also reach people who do not know your brand yet, without recruiting them from scratch. The MKOR panel in Romania has 110,000+ registered members (July 2026), and the questionnaire completion rate is 78%+ (source: MKOR, 2026). To learn how panellists are selected and validated, download the Panel Book 2026. For the questions you should ask any online research provider, see MKOR’s answers to ESOMAR 28 (ESOMAR has since published an updated edition with 37 questions).
For consumer data updated monthly, there is also Consumer Trends.Live: data collected from consumers about 7 industries (IT&C, fashion, jewellery and watches, personal care and cosmetics, furniture and decor, electronics and appliances, DIY).
Sampling and data quality
The sample decides who answers your questionnaire, and data quality decides how far you can rely on the answers. Below you will find the sampling steps, the rule for the number of respondents, the checks that keep the data clean and what you tell respondents about their data.
Sampling step by step
In a survey you do not ask the whole population you are interested in, but a sample of it. A sample is a number of units selected from the population the research targets. The population can refer to people, to the consumers of a certain product, to businesses or to people in a certain social group.
Sampling goes through six steps:
- Define the population targeted by the research.
- Choose the sampling frame (the list you select from: customer base, a panel, a register).
- Choose the sampling method.
- Decide how you select the units of the sample.
- Set the sample size.
- Carry out the fieldwork.
At step 3 you choose between two families of methods. In probability sampling, every unit in the sampling frame has a known chance of being selected (for example, random selection from a list). In non-probability sampling, selection depends on convenience or on your judgement (for example, customers who answer a link on social media, or quotas by gender and age). The first lets you calculate a margin of error; the second is faster and cheaper, but its results cannot be generalised as safely. You choose according to how easy it is to reach the target audience and how important representativeness is.
How many respondents you need
There is no single number that works for every study. It depends on how precise you want the result to be and how many groups you want to compare. One benchmark is the margin of error: for a simple random sample, at a 95% confidence level, the maximum margin is approximately 1.96 × √(0.25 / n), where n is the number of respondents.
Our own calculation: with 1,000 respondents you get approximately ±3.1%, with 400 respondents approximately ±4.9%. If you want to compare groups (for example, women aged 25-34 in large cities), what matters is the number of respondents in that group, not the total.
Weighted data have a larger margin. In the AI Adoption Report Romania 2026, mentioned under searching for information, the 1,031 valid interviews were weighted to a base of 1,000. The maximum margin of error, calculated as for a random sample and adjusted for the effect of weighting, is ±4.1%. For an online panel the figure is indicative, because the sample is not probability-based.
Quotas and weighting
Quotas set in advance how many respondents you want from each group (gender, age, region, urban or rural), so that the sample resembles the population. Weighting corrects after fieldwork ends: if one group answered less often, its answers get a greater weight, and those of the group that answered more often get a smaller one. In the AI Adoption Report Romania 2026 (the August wave, where the 70% figure comes from), weighting was done by gender, age, macro-region and urban or rural residence.
Weighting helps, but it does not repair a wrong sample: it cannot replace the people who are missing from the sample.
Data quality: fake respondents, bots and rushed answers
In online surveys that anyone can join (“opt-in”), some respondents answer without reading, just for the reward, and others are fake profiles or automated programs (bots). Pew Research Center gives a US example: in an opt-in poll from February 2022, 12% of adults under 30 said they were licensed to operate a nuclear submarine, although the real share is practically zero. The example shows how insincere answers can inflate results for small groups.
What you can do: add control questions (for example, “select option 3”), remove questionnaires completed unusually fast or with the same answer throughout, check for duplicates and ask your panel provider how they validate their members.
GDPR: what you tell respondents
Before the first question, tell the respondent:
- who is running the study;
- what data you collect and what you use it for;
- how long you keep it;
- that participation is voluntary and that they can withdraw at any time.
Collect only what you need and, where you can, anonymise the answers: do not keep the name or email next to them. For audio or video recordings (interviews, focus groups) you need a legal basis, usually the respondent’s consent. The rules are in Regulation (EU) 2016/679 (GDPR); if in doubt, ask a lawyer.
Measure loyalty: the NPS score
The NPS score measures, with a single question, how willing your current customers are to recommend you. It is the tool for the last stage of the purchase process, post-purchase evaluation, and you can repeat it every quarter.
How the NPS score is calculated
Net Promoter Score (NPS) is a widely used performance indicator. It measures the difference between the promoters and the detractors of a product, a service or a company. It was proposed by Fred Reichheld in the article “The One Number You Need to Grow”, published in Harvard Business Review in 2003.
NPS = % Promoters minus % Detractors
To calculate it, you ask one essential question: “How likely are you to recommend product / service / company X to a friend or colleague?” Answers are given on a scale from 0 to 10, where 0 means “not at all likely” and 10 means “extremely likely”.
- Promoters (score 9-10) are enthusiastic, loyal consumers who buy again more often and recommend the brand to others. You can improve the relationship with promoters through constant communication, offers and post-purchase messages.
- Passives (score 7-8) are satisfied but not enthusiastic consumers, vulnerable to competitors’ offers. To get a higher score and avoid a growing number of detractors, you have to work at turning passives into promoters.
- Detractors (score 0-6) are unhappy consumers who can harm the brand by spreading negative opinions by word of mouth. To reduce the number of detractors, you have to investigate the reasons for their dissatisfaction and then find the right solution.
Illustrative example (invented figures, for the calculation only): out of 100 respondents, 50 give scores of 9-10, 30 give 7-8 and 20 give 0-6. NPS = 50 minus 20 = +30.
How to interpret the score and what to compare it with
Net Promoter Score can range from -100 to +100. The higher the score, the more clearly promoters outnumber detractors. If the result is negative, detractors outnumber promoters, a signal that it is worth finding out quickly why customers are unhappy.
Compare the score across regions, shops, sales agents or customer segments. The differences show you where the problem appears and where to look for the solution.
The score says even more when you compare it with competitors or with the industry average, if you have a benchmark for your field. For retail, MKOR has published an industry benchmark: the NPS Score in Romania’s Retail Market in 2022, based on data from April 2021 to March 2022. The benchmark is old, so use it only as a starting point, and in other industries compare your score with your own measurements from earlier periods.
NPS and satisfaction are different indicators, but they complement each other. NPS measures how likely people are to recommend a product, service or company, while satisfaction describes how they feel about their experience of using it. A consumer with a good experience is more likely to recommend you than one who is dissatisfied.
NPS also has limits. Being a single number, it does not tell you why people give a certain score, so add an open question (“Why did you give this score?”). A score calculated on a small or unrepresentative sample can give a false picture. Calculate it on enough responses and track it over time rather than relying on a single measurement.
You can read more about NPS in MKOR’s articles on Net Promoter Score: part I and part II.
AI and your target audience: what helps and what misleads
AI helps you work faster on questionnaires and on analysing answers, but it cannot replace real respondents. The result depends on how carefully you check what it gives you.
Where AI helps
AI saves you repetitive work: it can suggest a first draft of a questionnaire, group open-ended answers by theme or summarise interview transcripts. Use it like an assistant that prepares the material. Check the questionnaire draft (double-barrelled or leading questions, question order), read some of the grouped answers yourself and compare the summary with the recording. MKOR’s approach is the same: AI reduces repetitive work, while interpretation and methodological control stay with people (see AI in Market Research: Why Speed is Not Enough).
AI-generated profiles are only hypotheses
A synthetic persona is a customer profile generated by an AI model, sometimes with “answers” to survey questions. Academic research has tested how close such answers come to those of real people, and the conclusions are mixed. Argyle and colleagues (2023, Political Analysis) showed that a language model, given real sociodemographic profiles as a reference, can reproduce response patterns of some US subgroups. Bisbee and colleagues (2024, Political Analysis) tested ChatGPT and found that:
- the averages generated come close to those of the reference survey;
- the answers vary less than those of real people;
- regression coefficients often differ significantly;
- results shift with small changes in wording, and the same question gives different results three months later.
The authors conclude that synthetic data are not reliable for statistical inference. Both studies used US political surveys.
A model does not measure real behaviour, does not know how people will react to a new product and is not aware of recent events. That is why you should write down any AI-generated persona as a hypothesis, and note next to it the question that tests it with real people. If a provider offers you AI-based services, ESOMAR has a free list of 20 questions to help buyers of AI-based services.
Risks: invented data, bias and privacy
A model can invent figures and sources and present them as if they were certain. It can repeat stereotypes from the data it was trained on. Check every figure against the original source.
Do not upload personal data, audio or video recordings or customer lists to AI tools without a legal basis and without knowing what happens to the data. GDPR applies (see the GDPR section), and Regulation (EU) 2024/1689 (the Artificial Intelligence Act) sets obligations for those who develop and use such systems.
Conclusions and recommendations
Without target audience analysis, your conclusions about the market and the competition do not turn into decisions about product, price and message.
A market study is not a one-off: repeat it periodically to see how your customers change. If you want to see what a complete market study involves, read about MKOR market research.
Your first step, tomorrow: write down the decision you want the data to help you make (not “I want to know my audience” but, for example, “Where should I invest next quarter’s communication budget?”), then follow the five steps at the top of this guide.
What you can do yourself and when to call in specialists
You can handle these yourself: customer interviews, analysis of your own data and a short questionnaire in your shop or to your customer base. Call in specialists when:
- the decision is expensive (a launch, an expansion);
- you need a sample that is representative of the general population;
- you want to compare yourself with the market;
- you need respondents from outside your customer base, recruited and informed in line with GDPR.
A research company has done many studies like yours, so it knows from the start where a sample or a questionnaire usually goes wrong.
How MKOR can help

We are a market research and strategic consulting company, founded in 2012, and this guide gathers what we have learned from our projects. We are ISO 9001 certified and received the “External Supplier of the Year” distinction from Iulius (Excellence Silver 2026).
For more details, you can explore the portfolio of studies we have worked on and read what clients say about us. If you want us to work together on your study, write to us here and we will reply as soon as possible.
Frequently asked questions
How do you do a target audience analysis?
What is the difference between target market, target audience and buyer persona?
How do you find out who your target audience is?
How many respondents do you need to survey your audience?
Can AI create personas or replace survey respondents?
How much does target audience research cost?
Want to know exactly who your customers are?
Tell us what decision you need to make. We will come back with a research proposal tailored to your project.
Request a quote · See an example
“We started working with MKOR in 2016 and we continued to develop new projects together ever since. […] We are delighted to have chosen working with MKOR, who have offered support from research design to final report delivery – in record time.” Andreea Gheorghiu, Head of Marketing, Edenred România.
110,000+ registered panel members (July 2026).