


Updated October 2026 · Alex Cimpoca
Market research is the process of collecting and analysing data about customers, competitors and the market so you can make a business decision based on evidence. It has 6 stages: objective, desk research, method, sample, fieldwork and analysis.
This is part 1 of a 3-part guide. It covers the steps, the methods, real examples and the tools for analysing a market. Part 2 is about competitor analysis and part 3 is about the target audience.
The first version appeared in 2017. In the October 2026 edition we added the step-by-step process, examples for a new product and a section on AI, updated the methods and sources, and removed outdated examples.
See the 6 stages · Methods · Examples
Want the full guide as a PDF? Leave us your email address and we will send it to you free of charge.
Content part 1
What is market research?
Market research answers a business question with data collected and analysed specifically for it. You will also see it called a market study, marketing research or consumer research, and opinion polling is one of its methods.
In practice, you find out what consumers need, how big the market is, what competitors look like and where demand is heading.
The data comes in two kinds:
- Secondary data already exists (official statistics, industry reports, your own sales data). You gather it at the desk research stage.
- Primary data is what you collect directly from people to answer your own question (surveys, interviews, focus groups).
Methods are either quantitative (they answer “how much” and “how many”: questionnaires, usually completed by hundreds of respondents, with results in percentages) or qualitative (they answer “why”: interviews and focus groups with few participants, in-depth discussion). Many studies combine the two.
What market research is not. It is not a Google search, and it is not a summary generated by an AI tool. Both can help with desk research, but neither measures what the people in your audience think and do. We cover the role of AI in research in the section on AI in market research.
How to do market research, step by step
Market research follows 6 stages: set the objective, do the desk research, choose the method, define the sample, collect the data and analyse it. You start from the decision you have to make and end with a clear recommendation.
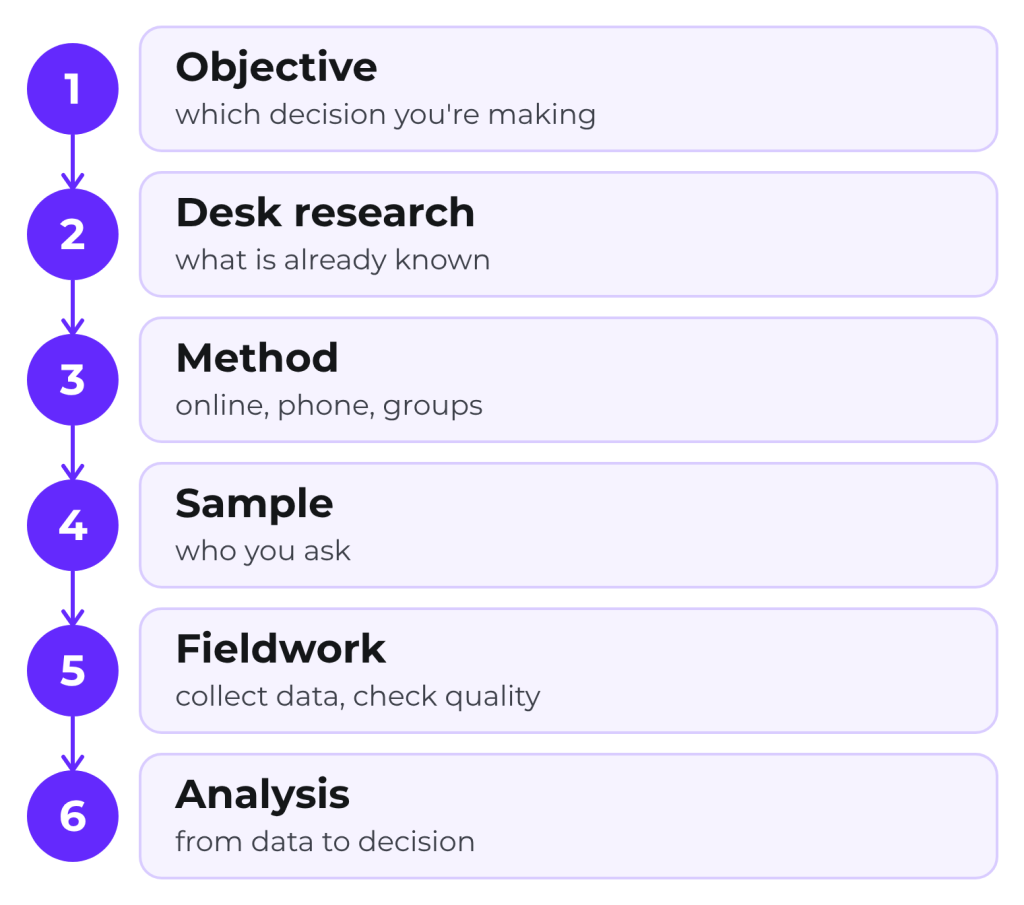
- Set the objective and the decision. Write down the question the study has to answer and the decision it will inform.
- Do the desk research. Collect what is already known: official statistics, industry reports and your internal data (sales, CRM, old surveys). You find out what is missing and avoid paying twice for the same information. You will find reliable sources in the section Sources for desk research.
- Choose the method and write the questionnaire. Quantitative or qualitative, online (CAWI), by phone (CATI) or face to face: the choice depends on the question, the audience and the budget. Then write the questionnaire or interview guide and test it on a few people before fieldwork. You can compare methods in the section Research methods.
- Define the sample. Decide whom you ask and how many respondents you need. As a rule of thumb, a random sample of 1,000 respondents gives a margin of error of at most ±3.1% at a 95% confidence level. We explain how to choose the audience and the sample in part 3, on the target audience.
- Collect the data (fieldwork). Run the questionnaire or interview guide and check the quality of the answers as you go: duplicate respondents, answers given too fast, answers that make no sense.
- Analyse the data and turn it into decisions. Clean and process the data, interpret it and answer the question from stage 1, with concrete recommendations you can act on.
The stages are not always linear. Desk research may force you to rephrase the objective, and fieldwork sometimes raises new questions. What matters is that stage 1 is clear before you spend money on stages 4 and 5.
How to write the objective
A good objective names the decision you will take based on the study. Usually the business has a need or has spotted an opportunity but lacks the data to decide. When the problem is stated clearly from the start, the study stays focused. “Should we launch product X on the Romanian market, and at what price?” is an objective. “We want to know what people think” is not.
Example: market research for a new product
Hypothetical example: a producer wants to launch a single-serve specialty coffee in 2026.
- Objective: is it worth launching, and at what price?
- Desk research: data on the coffee market and on competitors.
- Method: two focus groups to test reactions to the concept, then an online survey.
- Sample: 1,000 coffee buyers, representative by gender, age and region.
- Fieldwork: a 10-minute questionnaire with quality control.
- Analysis: how much interest there is by segment and what price people accept, then the decision: launch, adjust or drop it.
Market research methods: which to choose and when
Choose the method based on the question, the audience and the budget. Below are the methods used most often, each with when to use it, what you get and its limits.
- Desk research. When: you are starting a new subject or have a small budget. You get: an overview from public sources. Limits: the data may be old or about a different market.
- Online survey (CAWI). When: you want figures about a wide audience, quickly. You get: percentages by segment. Limits: it does not tell you the reasons, and the result depends on the quality of the sample.
- Telephone interview (CATI). When: the audience is hard to reach online or you want a controlled sample. You get: quantitative answers collected by an interviewer. Limits: the questionnaire has to be short.
- Face-to-face interview. When: you want to show people a product or let them taste it, or the audience does not answer online or by phone. You get: quantitative or qualitative answers collected by an interviewer at the respondent’s home, in a shop or in the street. Limits: it costs more and takes longer than online or phone.
- In-depth interview. When: you want to understand motives and decision processes. You get: detailed stories in the respondents’ own words. Limits: you speak to few people, so you cannot generalise in percentages.
- Focus group. When: you are testing concepts, ads or packaging. You get: reactions and arguments from the group discussion. Limits: the group influences its members, and the result is not statistically representative. See focus groups.
- Mystery shopping. When: you want to know what the service is really like. You get: a point-by-point evaluation of the customer experience. Limits: one visit is a single observation, so you need many. See mystery shopping.
- Semiotic research. When: you want to understand what a brand or an ad means in your audience’s culture. You get: an interpretation of the meanings and codes in the communication. Limits: it is a specialist analysis, usually combined with qualitative or quantitative research. Read about semiotic analysis.
- Analysis of existing data. When: you already have data in your CRM, your sales or old surveys. You get: answers without new data collection. Limits: data gathered for another purpose does not always answer your question.
Online surveys usually draw on an online panel: people who have already been recruited and have agreed to answer studies. The section on AI shows where AI can help with these methods. For studies about end consumers, see consumer research studies.
Market research examples
Below are four real studies from MKOR projects, three for a new product or business and one for a B2B market, each with the question, the method and the result. After them you will find four of MKOR’s own studies that you can download.
Market research for a new product or market
- Darvari Garden: launching its own product on the premium FMCG market. The question: how do consumers perceive the category? The study was carried out in 2021, ahead of the launch at the start of 2022. The method: mixed, with a questionnaire on a sample representative by gender, age and region, plus remote tasting sessions, which MKOR ran for the first time. The result: the launch strategy was built on this data.
- BurgerHouse, Ploiești: the opportunity for a new restaurant. The question: where, at what price and with what offer is it worth opening a burger restaurant? The method: an online survey (CAWI) of Ploiești residents aged 20 to 40, with questions on location, price, food preferences and delivery. The result: the investor had the data on location, price, offer and delivery before committing the money.
- Prodvinalco Cluj: launching new products. The question: which new products or modified recipes do consumers prefer? The method: blind tastings of 2 or 3 samples, in interviews and focus groups, with 25 to 500 respondents in each project. The result: the launch of new products, including Carpathia Vodka.
- Julien Style: the ventilation systems market. The question: how big is the market, who are the competitors and where are the opportunities? The method: desk research, 28 in-depth interviews with experts, interviews with over 25% of the players in the market, benchmarking of 10 competitors, B2B mystery shopping and a SWOT analysis. The result: the company positioned itself as a professional supplier and expanded into the commercial and industrial segments.
MKOR’s own studies you can download
Our own studies show you what a final report looks like: the questions asked, how the sample is described and how the results are presented. The first three are run on the MKOR Panel, on samples representative of the Romanian population by gender, age and region.
- AI Adoption Report Romania 2026: 70% of respondents use AI, but on average only 2 of the 11 tools included in the study.
- Consumer Sentiment Romania 2026: an analysis over 12 quarters. The share of pessimists rose from 74% (Q3 2023) to 87% (Q2 2026), while optimists fell from 16% to 8%.
- Black Friday 2025: 93% of shoppers plan their purchases in advance, and the average budget is RON 2,046, 33% more than the year before.
- The impact of market research in Romanian companies: a 2018 whitepaper based on responses from 252 company representatives in Romania.
Why and when to do market research in 2026
You do market research when you have a decision to make and lack the data for it, because it is cheaper to find out what customers want before a launch than after. With data in hand, you launch, test or adjust a product knowing which risks you are taking. The study data also lets you build a marketing strategy that fits your market.
What market research shows you
Market research shows you six things about your business:
- End consumers. What they want, what they need and what they think. You get to know them better and learn what to offer them.
- Demand, supply and distribution. You adjust production volumes to demand and see how well your distribution channels work.
- Promotion. How effective the media channels are for your message and audience. You track effectiveness over time through brand tracking.
- Reputation. What the market thinks of your company and products.
- Satisfaction. The level of customer satisfaction, whether you sell to consumers (B2C) or to companies (B2B).
- Prices. The right price ranges for your products and the discounts for partners and customers.
When to do market research
The most common situations:
You are launching or improving a product. Research helps you to:
- estimate the market potential of a new product, through a market opportunity study;
- find out how consumers react to the product and its packaging, through product testing;
- learn which types of consumers buy, why they buy and what they would improve about the product;
- estimate your sales volumes.
Do you only have a business idea? You can check it before you invest, through a business idea evaluation.
You want to understand why something is not working. A study shows why an existing product is not selling: the price, the communication or the distribution.
You want to know your market and your competition. A study helps you to:
- learn the general conditions and trends of the market;
- assess the strengths and weaknesses of competitors;
- estimate your market share;
- segment the market, that is, divide the population into groups with similar motivations according to criteria set in advance (psychographic, demographic, geographic or product usage).
When you do not need market research yet
- The decision has already been made and cannot be changed.
- The answer is already in your data (sales, CRM, website) or in public sources.
- The question is still vague. A vague objective produces a vague study, so formulate it first, as in the objective example.
If you are not sure, start with desk research: it costs little and shows you what is really missing.
General market analysis: sector study, benchmarking and PESTLE
General market analysis shows you what kind of market you are entering: how the sector is structured, who the best players are and which external factors shape it. It is part of desk research (stage 2) and has three tools: the sector study, benchmarking and PESTLE analysis.
The sector study
The sector study focuses on one sector and gives you data about the players in the market, its size and its consumers’ spending potential. From it you learn the profile of the market: how many producers and consumers there are and how large they are, which goods and services are sold and how easily customers find information about products and prices. It helps you see how well your business objectives fit the market you operate in or want to enter.
Comparing with the best (benchmarking)
Benchmarking complements the sector study. You identify the best companies in the field and compare their results with yours on quality, time and cost. This shows you which industry practices you can adopt and, above all, what drives those companies’ success.
PESTLE analysis
PESTLE gives you an overview of the external conditions of a market. The name comes from the initials of the six factors: Political, Economic, Social, Technological, Legal and Environmental.
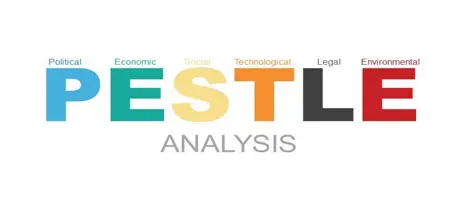
In the analysis you answer one question for each factor.
1. Political factors
What is the political situation and how does it affect your industry? What matters here are political decisions that affect the economy or a specific market, such as taxes, fiscal policy and trade tariffs. A recent example: from 1 August 2025, the standard VAT rate in Romania rose from 19% to 21%, and the reduced rates of 5% and 9% were merged into a single 11% rate, with some exceptions (Law 141/2025, source: Kreston Romania, in Romanian; for the rates in force today, see the PwC Worldwide Tax Summaries). For a business with small margins, the change shows up directly in the price or in the profit.
2. Economic factors
How does the economy affect your business? For example, rising inflation changes your pricing policy. You track the inflation rate, the interest rate, the exchange rate and the level of foreign investment. How people perceive the economy matters too: the study Consumer Sentiment Romania 2026 shows how the mood of Romanians changed between 2023 and 2026.
3. Social factors
Which values, habits and demographic changes influence your customers? Social structure and demographics help you recognise cultural trends. Local holidays can be profitable for certain industries, such as 8 March (International Women’s Day) for florists in Romania. You also track how buying habits change, for example how far in advance people plan seasonal purchases.
4. Technological factors
Which new technologies could change your market? Innovations can help or hurt a company’s operations: technologies that automate work or cut energy use lower costs, while others can make your product obsolete or bring in new competitors. A current example is AI, which 70% of the respondents in the AI Adoption Report Romania 2026 already use. The useful question for your analysis is how this changes the way your customers search, compare and buy.
5. Legal factors
Are there regulations for your industry, and are changes on the way? Look at the legislation, regulations and institutions that apply to you, especially those on consumer and employee safety. A legal analysis helps you avoid breaches and penalties. In 2026, for example, the EU AI Act (Regulation (EU) 2024/1689) imposes new obligations on companies that sell AI systems or use them when dealing with customers. The section on personal data explains what GDPR and the AI Act mean for your study.
6. Environmental factors
What environmental concerns exist? Every economic activity affects the environment, and the analysis takes weather, geography and climate change into account. For example, a company with warehouses or transport has to plan for what happens when floods, landslides or earthquakes stop its operations.
PESTLE results go straight into the launch plan: they show which external risks you have to cover before you invest.
Why context matters
A figure without context can mislead. Set it against a short history of the industry and a description of the market, then define the target market, so that the marketing strategy starts from the same market you measured.
Sources for desk research
The most reliable sources for desk research are the public databases of institutions in Romania and the EU. You can find almost all of them online, but not every page on the internet is a reliable source, so put every figure through the 3 checks below. You will find more resources in the article on research and documentation resources. The sources we use most often:
Official statistics
- European Union Open Data Portal: public datasets from European institutions.
- Eurostat: statistics comparable across EU countries.
- Eurobarometer: public opinion surveys at European level.
- National Institute of Statistics: databases and metadata from Romania.
- Open data portal of the Romanian Government: datasets from institutions and ministries.
Company data
- National Trade Register Office (in Romanian): official data on companies in Romania.
- National Agency for Fiscal Administration (in Romanian): official tax information.
- Company annual accounts (turnover, profit, number of employees), free of charge on the website of the Ministry of Finance (in Romanian) or on financial analysis sites.
Sector and consumer data
- Professional associations, for example the list of food industry associations (in Romanian): information from one sector of the market; they often run their own studies.
- Trade associations, for example the Association of Large Retail Chains in Romania (in Romanian): statistics for specific areas of retail and trade.
- Chambers of commerce, from the Chamber of Commerce and Industry of Romania (in Romanian) to the county chambers: useful when you need a regional breakdown.
- Consumer protection organisations (in Romanian): retail prices and consumer studies, published or provided on request.
- The press: business, financial and political news.
- Other market research agencies: market reports and studies for specific industries.
Not all information is online. Some of it exists only on paper, at the organisations above, in libraries or in archives.
3 checks before you use a source
- Who published it? An institution, a company or an anonymous author? And what is their interest?
- When? Check when the data was collected, which can be years before the page was published.
- How was it collected? Look for the sample, the method and the period. If they are missing, do not use the figure.
The same three questions apply to texts produced with AI tools, which sound confident and can still be wrong. Ask for the source and check it.
How attractive is the industry: Porter’s 5 forces
Porter’s 5 forces show how intense competition is in an industry and who captures most of the value created. The model comes from Michael Porter, who published it in 1979 in the Harvard Business Review and developed it in the book Competitive Strategy (1980).
A market study gives you the data for each force: how many competitors there are, how easily others can enter, what alternatives customers have, how much bargaining power buyers hold and how much you depend on suppliers. With them you see how attractive the industry is before you enter or invest more. You will find how to apply the model step by step in part 2 of the guide, and if you would rather have us do the analysis, see competitive analysis.

In short: the five forces are rivalry between players, new entrants, substitute products, buyers and suppliers. The weaker they are, the more attractive the industry.
1. Rivalry between players
A market with low rivalry is attractive, because players are not forced to cut prices and they keep their margins. To assess it, you look at how many competitors there are, how they differ, whether the market is growing or shrinking, how aggressive the players are and how widespread they are geographically. Then you look at the levers they use: price, product variety and style, campaigns and promotions.
2. Threat of new entrants
Companies that are not yet in the market but could enter can also take your customers. The threat grows as barriers to entry fall. When entry costs are high, for example the initial investment in technology, it is harder for a new player to get in.
3. Threat of substitute products
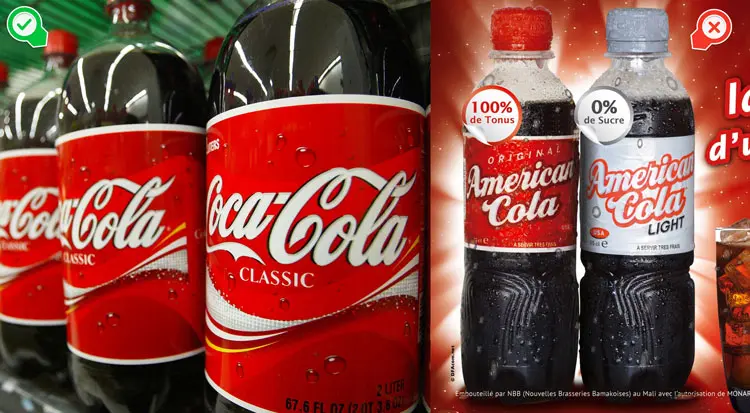
A substitute product comes from another category but meets the same need as your offer. The threat grows when a substitute offers better value for money. For example, email replaced letters, and streaming platforms compete with cinemas.
4. Bargaining power of buyers
Customers can demand lower prices or better service at the same price. Their power grows when they are few and buy a lot, or when products are so similar that switching from one brand to another costs nothing.
5. Bargaining power of suppliers
Strong suppliers can raise prices or impose terms that favour them, and the industry’s profitability falls. This happens when there are few suppliers and many customers, for example only two suppliers for an important material, or when switching supplier is expensive.
Market potential and market size

The potential market is all the customers who have the need you meet and the money to pay for it, in a given area and period. You estimate it to know whether it is worth entering: if the market is too small, even a good product will not find enough buyers.
Sales forecasting estimates how much customers will buy in a given period. The result differs from one segment to another, depending on how much the segment can absorb, how strong the competition is and how your offer is positioned. In practice, you estimate future turnover from the probable sales volume.
Market share is the part of the total sales of a category, by value or volume, that goes to your company in a given period.
Geographic scope is the territory you operate in. By place of sale, a market can be domestic (in Romania), foreign (in other countries) or global.
In the end, the study tells you how many potential customers you have, what quantities they buy, how often and how much the market can grow.
How to estimate market size: a simple example
There are two approaches, and they check each other. Hypothetical example, with invented numbers for explanation, not market data: a specialty coffee producer wants to estimate the market in Romania.
- Top-down: you start from the large market. If the coffee market is (hypothetically) worth RON 3 billion a year and the specialty segment is 2% of it, the result is RON 60 million.
- Bottom-up: you start from the customers. Of 5 million households (hypothetically), 4% buy specialty coffee, which is 200,000. If each buys 8 packs a year at RON 40, the result is RON 64 million.
- The check: the two estimates differ by about 7%, so a range of RON 60 to 64 million is credible. If they differ a lot, you adjust the assumptions.
The assumptions in the second approach (how many buy, how often, at what price) are exactly what a survey measures. That is how market size links to stages 3 and 4 of the process: the method and the sample.
How to follow market trends in 2026

You follow trends in two steps: collect signals from Google Trends, published studies and the trade press, then check with a survey how widespread they are in your audience.
What to track
- Customer experience. How much customers care about the way a brand treats them, alongside price.
- Industry trends and cross-market trends. Some show up only in your sector, others cut across all markets. First check which ones actually affect your audience.
- Competitor moves. Companies create trends, so track what they do: you either align with them or offer something different.
- Online behaviour. See where your customers look for answers and where they buy, including whether they use AI assistants to compare products.
Where to track them
- Google Trends: search interest by topic and by country, over time.
- MKOR studies: free reports on consumers in Romania, updated in 2026.
- Consumer Trends.Live: monthly data collected directly from consumers, in 7 retail industries (fashion, IT and telecoms, cosmetics, DIY, electronics and appliances, jewellery and watches, furniture), monitored since May 2021.
- The trade press and the reports of associations in your industry.
For example, if Google Trends shows that more and more people are searching for specialty coffee, a survey tells you how many of your customers already buy it and at what price.
AI in market research: what helps and what does not
AI can speed up parts of a market research study, but it does not replace real respondents or the researcher’s judgement. Use it as an assistant and always check its output.
Where AI helps
- drafting and translating the first version of a questionnaire;
- coding open-ended answers into categories;
- transcribing and summarising interviews and focus groups;
- cleaning data, for example flagging duplicate answers.
Synthetic respondents: when you can use them
Synthetic respondents are profiles simulated by an AI model that answer a questionnaire in place of real people. An article in the NIM Marketing Intelligence Review (Kaiser et al., 2026) shows that such answers predicted individual responses better than chance and picked up broad trends. They were nonetheless systematically more positive, especially about well-known brands, and less varied than real answers. According to the authors, for now they suit early concept tests and low-stakes applications rather than decisions that need precision. Use them to form hypotheses, then check those hypotheses with real people.
Data quality: bots and fraudulent respondents
AI can also fill in questionnaires. In a study published in PNAS (Westwood, 2025), an AI agent passed 99.8% of the attention checks designed to catch automated answers. Simple checks are no longer enough, so how the panel is recruited and verified matters. For the questions to ask your provider, see how to choose an agency.
What GDPR and the EU AI Act say
Transcripts, recordings and contact lists contain personal data, so they fall under the GDPR. Before you upload them to an AI tool:
- establish the legal basis, usually informed consent, and tell participants that you use AI;
- anonymise the data where you can;
- sign a data processing agreement with the AI provider (Article 28 GDPR);
- check where the data is stored, for how long and whether the provider uses it to train its models;
- set a retention period and stick to it.
Regulation (EU) 2024/1689 on AI (the AI Act) applies in stages, according to the European Commission:
- From 2 August 2026: most of the regulation applies, including the transparency rules. People must be told when they interact directly with an AI system, for example a chatbot that conducts an interview.
- From 2 December 2027: the rules for high-risk systems in sensitive areas such as recruitment or education, postponed by the AI Omnibus (in force since 27 July 2026).
- From 2 August 2028: the rules for high-risk systems in regulated products.
In Romania, the supervisory authority for personal data is ANSPDCP, the National Supervisory Authority for Personal Data Processing. For specific situations, get legal advice.
Who can do market research?
Research can be done in-house, in the marketing department, or outsourced to an agency. In-house, you know the company well, but you often lack the methodology and a panel of your own. With an agency you pay for those, plus an outside view.
How to choose an agency: 5 checks
- Transparent methodology. Ask for the study design, the sample and the margin of error, in writing.
- Panel and data quality. Ask how they recruit respondents, how they confirm their identity and how they remove suspicious answers. The MKOR Panel has over 110,000 members, and the Panel Book 2026 explains how we build it.
- Answers to ESOMAR 28. ESOMAR has published a list of questions to put to an online sample provider (the classic version has 28, the updated one has 37). MKOR’s answers are in the ESOMAR 28 document.
- Relevant portfolio. Ask for examples from your industry and with the method you need.
- Who does the analysis. Ask who interprets the data and what experience they have. If the agency uses AI, ESOMAR offers 20 questions you can put to them.
For costs, see the pricing page.
Frequently asked questions
How do you do market research for a new product?
How much does market research cost?
How long does market research take?
What are the main market research methods?
Can AI replace real respondents in market research?
Should I do market research myself or hire an agency?
Do you need help from specialists?
MKOR carries out market research, satisfaction studies, target audience segmentation and customer profiling, competitive analysis and market opportunity studies for new markets. See what clients say.
“We started working with MKOR in 2016 and we keep developing new projects together. In recent years we have worked with them on some of the most complex studies of our beneficiaries’ and customers’ satisfaction.”
Andreea Gheorghiu, Head of Marketing, Edenred Romania
Request a quote · See the portfolio
Continue with part 2 and part 3
- Part 2 of 3: Competitor analysis. How to identify competitors and track their moves. Read part 2
- Part 3 of 3: Target audience analysis. How to segment and understand the people you sell to. Read part 3