![]()
Access the Evolution of Online and Offline Consumption in Q2-Q3 2021 for:
Fashion
How it helps you: See the consumption share of the total population, purchase channels (online / offline / omnichannel), purchase frequency, average budget, place of purchase, and top brands.
Visualization: Monthly evolution trends (MoM), total market
Sample: monthly, representative, minimum N=400 respondents
Data flow: Q2-Q3 2021
250 €
Beauty & Care
How it helps you: See the share of consumption in the total population, acquisition channels (online / offline / omnichannel), purchase frequency, average budget, place of purchase, and top brands.
Visualization: Monthly evolution trends (MoM), total market
Sample: monthly, representative, minimum N=400 respondents
Data flow: Q2-Q3 2021
250 €
Jewelry & Watches
How it helps you: See the share of consumption in the total population, acquisition channels (online / offline / omnichannel), purchase frequency, average budget, place of purchase, and top brands.
Visualization: Monthly evolution trends (MoM), total market
Sample: monthly, representative, minimum N=400 respondents
Data flow: Q2-Q3 2021
250 €
IT & C
How it helps you: See the share of consumption in the total population, acquisition channels (online / offline / omnichannel), purchase frequency, average budget, place of purchase, and top brands.
Visualization: Monthly evolution trends (MoM), total market
Sample: monthly, representative, minimum N=400 respondents
Data flow: Q2-Q3 2021
250 €
Home Appliances
How it helps you: See the share of consumption in the total population, acquisition channels (online / offline / omnichannel), purchase frequency, average budget, place of purchase, and top brands.
Visualization: Monthly evolution trends (MoM), total market
Sample: monthly, representative, minimum N=400 respondents
Data flow: Q2-Q3 2021
250 €
Home & Deco
How it helps you: See the share of consumption in the total population, acquisition channels (online / offline / omnichannel), purchase frequency, average budget, place of purchase, and top brands.
Visualization: Monthly evolution trends (MoM), total market
Sample: monthly, representative, minimum N=400 respondents
Data flow: Q2-Q3 2021
250 €
Discover top indicators from the market of interest
Ponderea consumului din total populație
National representative sample
Buget mediu
Split by months May - October
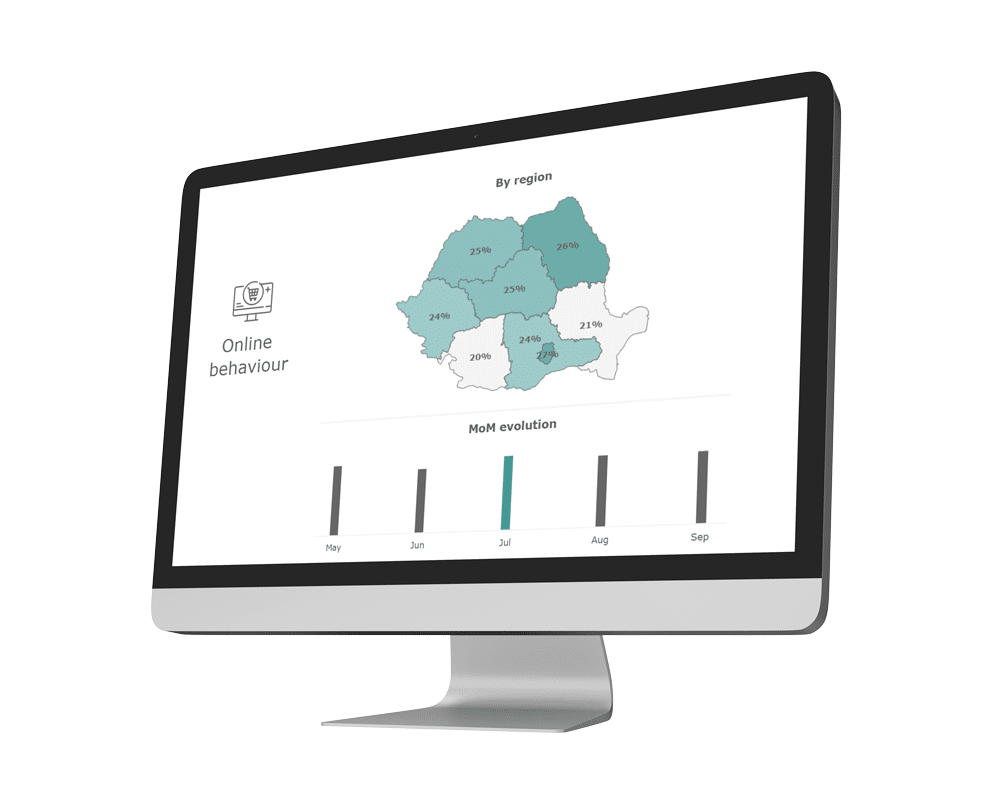
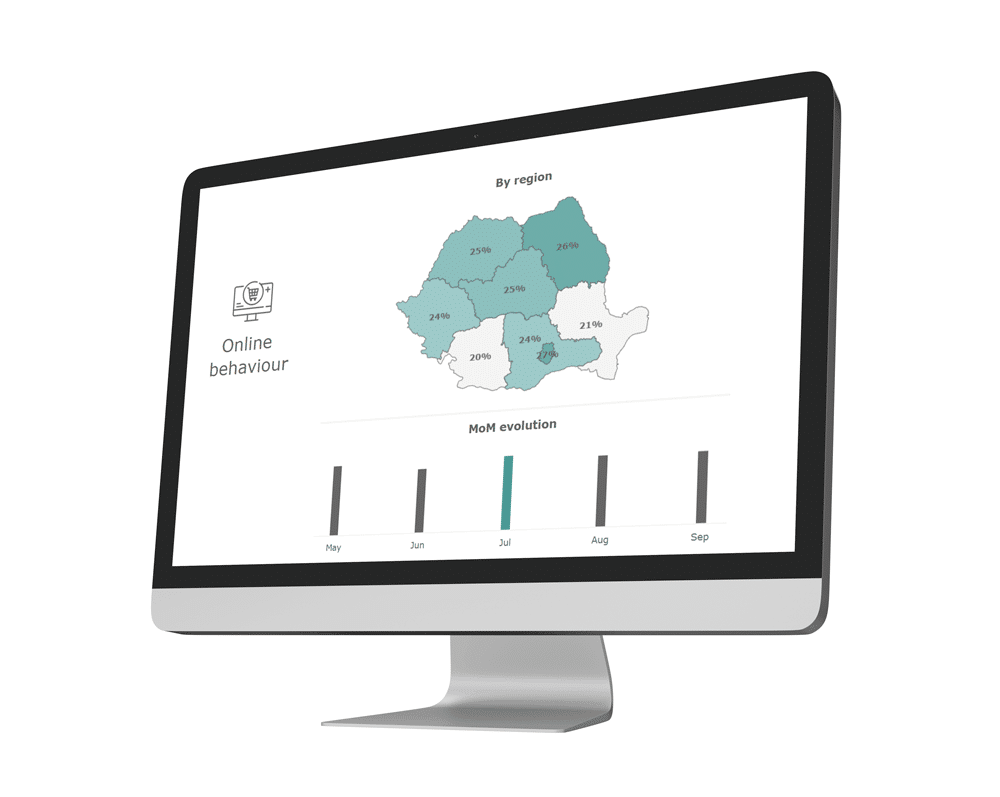
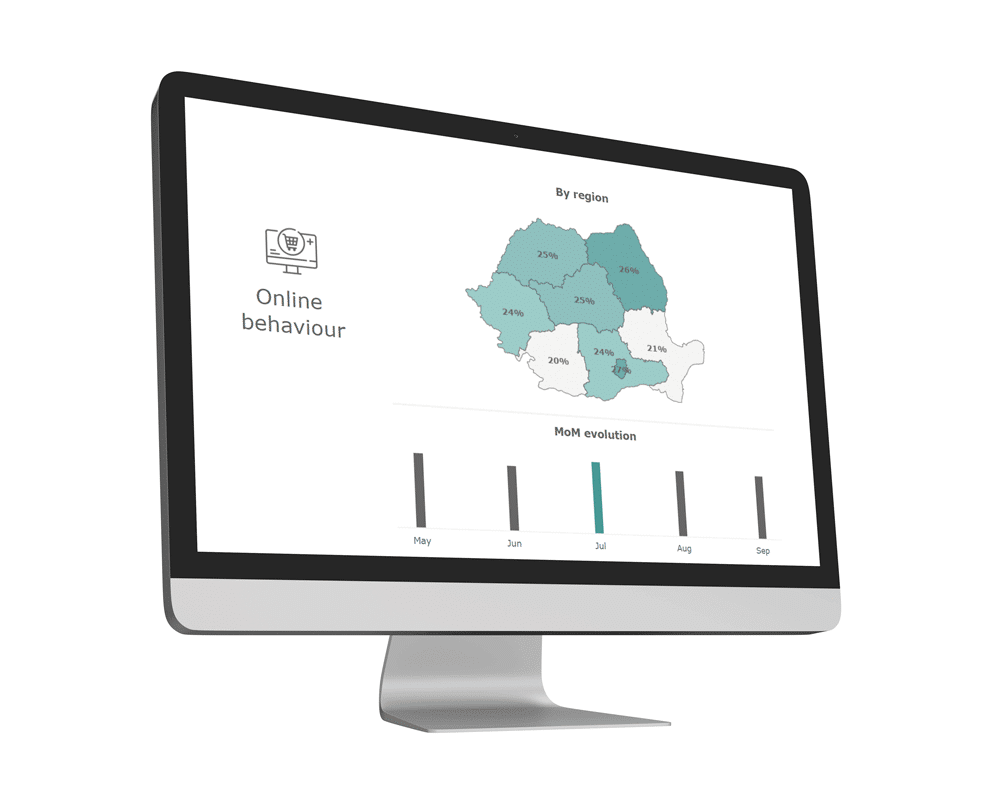
Canale de achiziție (online / offline / omnichannel)
Split by months May - October & regions
Loc de achiziție
Online / offline / specialized stores
Frecvență de achiziție
Split by months May - October
Top branduri
From the consumers' perspective
Methodology
Data on Online and Offline Consumption in Q2-Q3 2021 comes from the first live market study in Romania: Consumer Trends.Live.
- Sample: national representative based on gender, age, and region criteria
- Confidence level 95%, max. error +/-5%
- N=400 valid respondents, guaranteed minimum
- Target: general population of Romania (18 – 65 years old)
- Research method: opinion poll
- Instrument: questionnaire
- Approach: online, via the MKOR Panel
Consumer Trends.Live
Consumer Trends.Live is the first live market study in Romania that offers instant access to data directly from consumers.
Thus, for the first time, retailers have the opportunity to base their business strategy on .Live data from the market of interest.
This digital market intelligence tool is the basis for the analysis of consumption evolution in Q2 and Q3 in the pandemic year 2021.