DIY Market Evolution.Live
Consumer Trends.Live provides access to the DIY market consumer habits, for the first time. Gain competitive advantage with real-time data.
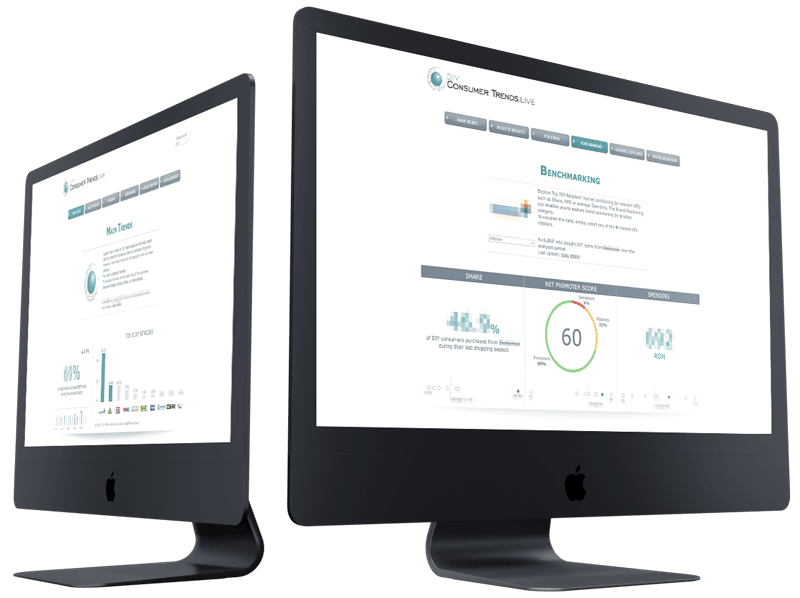
Connect to the DIY Market Data. Access it whenever you need them.
Real time data
The latest consumer data from the DIY market, collected monthly
Professional analysis
Data analyzed by experts, which you understand at a glance
Interactive view
Interactive dashboard and in-depth analysis with a single click
24/7 access
Dashboard with updated market data available at any time
Top most appreciated brandsDIY Market.Live— real-time updated data —
Loading, please wait...
BATHROOM & KITCHEN
LIVING ROOM
BEDROOM
GARDEN & PATIO
BUILDING MATERIALS
ACCESSORIES
ELECTRICAL ITEMS
PAINTS
INTERIOR DESIGN
MACHINERY
We monitor.Live indicators that help you improve your strategy and gain competitive advantage.
Stay connected to the market trends.
Analyze the data whenever you need it.
Make informed decisions when it matters.
DIY
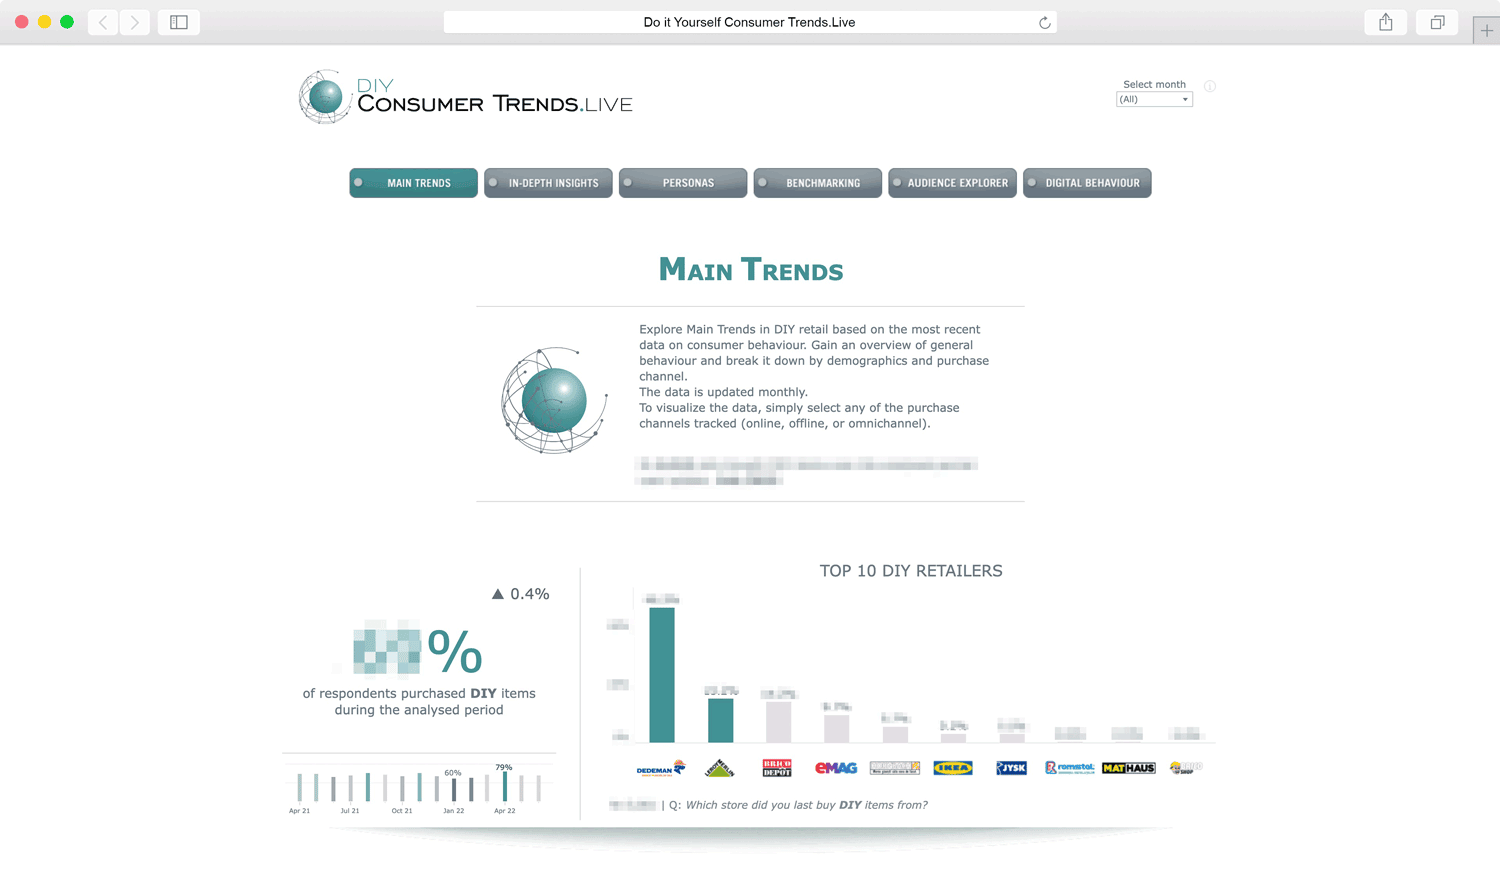
Main Trends
Observe the DIY market trends, as they occur!
How it helps you: Monitor the evolution of the main market consumption indicators, for a strategic perspective on the market. Understand the seasonality and how it influences the pursued indicators, in order to quickly adapt to changes in the market.
Categories: Bathroom & Kitchen, Living Room, Bedroom, Garden & Patio, Building Materials, Accessories
Visualization: Monthly evolution trends (MoM), total market
Sample: Monthly, representative, minimum N = 400 respondents
Data flow from: March 2021
Analyzed data:
- Category share / total consumption
- Purchasing channel (online / offline, store type)
- Purchasing frequency (monthly, All DIY)
- Spent budget vs. planned budget
- Detailed breakdowns by demographics (gender, age, income, education, area of residence, development region)
You have access to all this data in any of the Consumer Trends or Full Market Insights subscriptions.
DIY
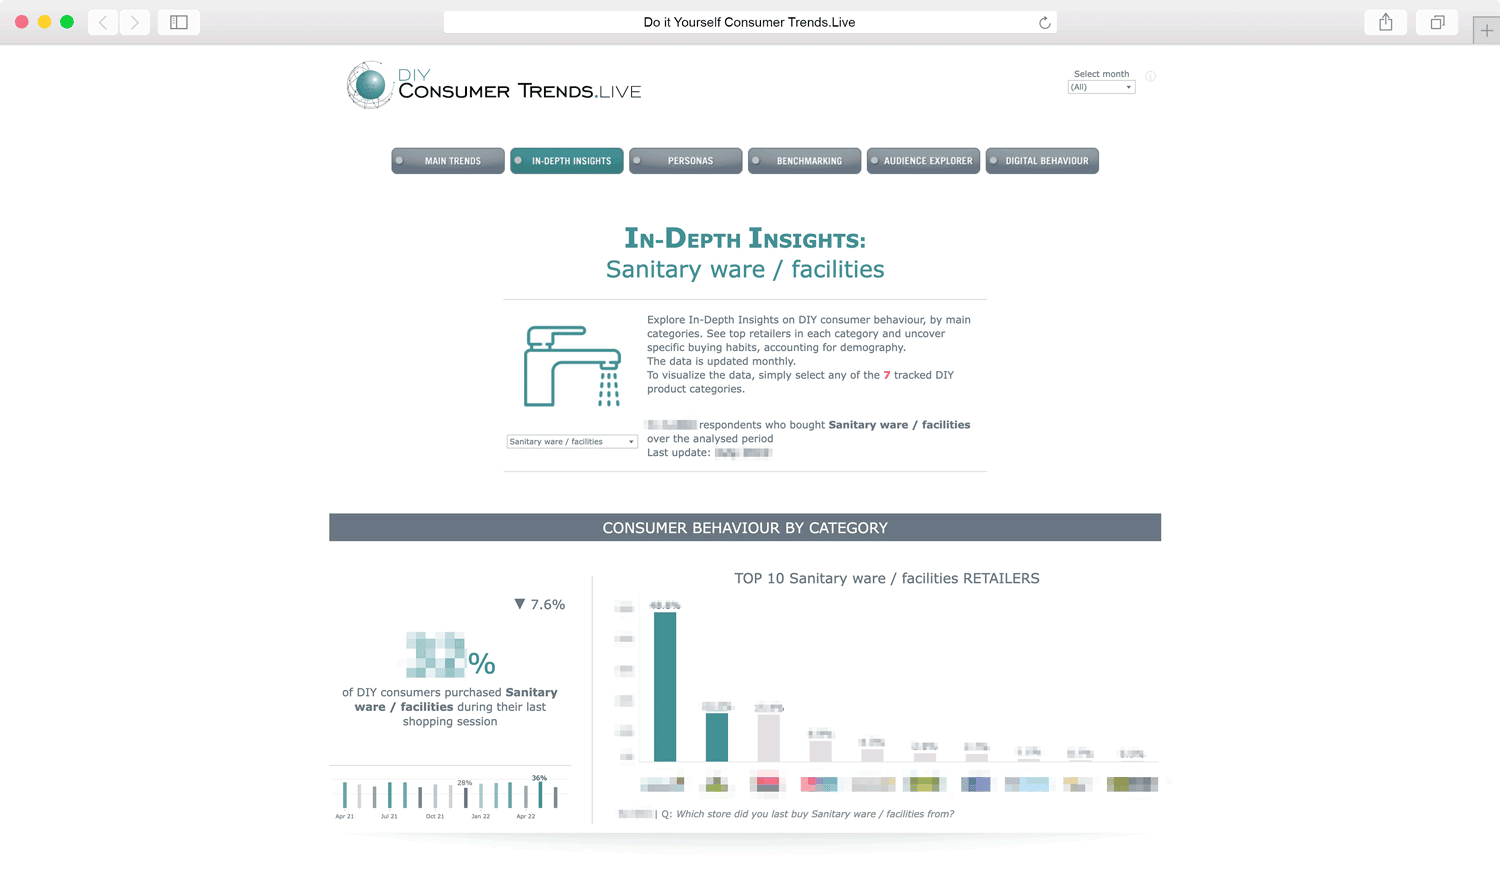
In Depth Insights
Analyze the evolution of the main consumption indicators for the DIY categories
How it helps you: Monitor the evolution of the main consumption indicators in the market, by categories, for an in-depth perspective on the market. Understand the seasonality by categories and how it influences the pursued indicators, in order to quickly adapt to changes in the market.
Categories: Sanitary installations (bathroom & kitchen), Materials for insulation, Materials for waterproofing, Cement, mortars, plasters, screeds, screeds, Materials for partition walls and ceilings, Construction materials: iron, masonry, Materials and installations for sewerage and drainage, Roofing materials and structures, Wood & carpentry, Doors, windows, Tiles, tiling & accessories, Parquet, carpeting & accessories, Hardware (screws, nails, furniture accessories, etc.), Paints, Wallpaper, Adhesives & glues, Objects and materials for the garden, Heating objects and installations, Air conditioning & ventilation objects and installations, Interior decorations (textiles, blinds, paintings, decorative objects, etc.), Lighting fixtures, Objects and accessories for electrical installations, Machines, tools and tools, accessories and consumables
Visualization: Monthly evolution trends (MoM), total market
Sample: monthly, representative, minimum N = 400 respondents
Data flow from: May 2021
Analyzed data:
- Category share / total consumption
- Top brands / category
- Purchasing channel (online / offline, store type)
- Purchasing frequency (monthly, All DIY)
- Budget spent / Category
- Detailed breakdowns by demographics (gender, age, income, education, area of residence, development region)
You have access to all this data in any of the Consumer Trends or Full Market Insights subscriptions.
DIY
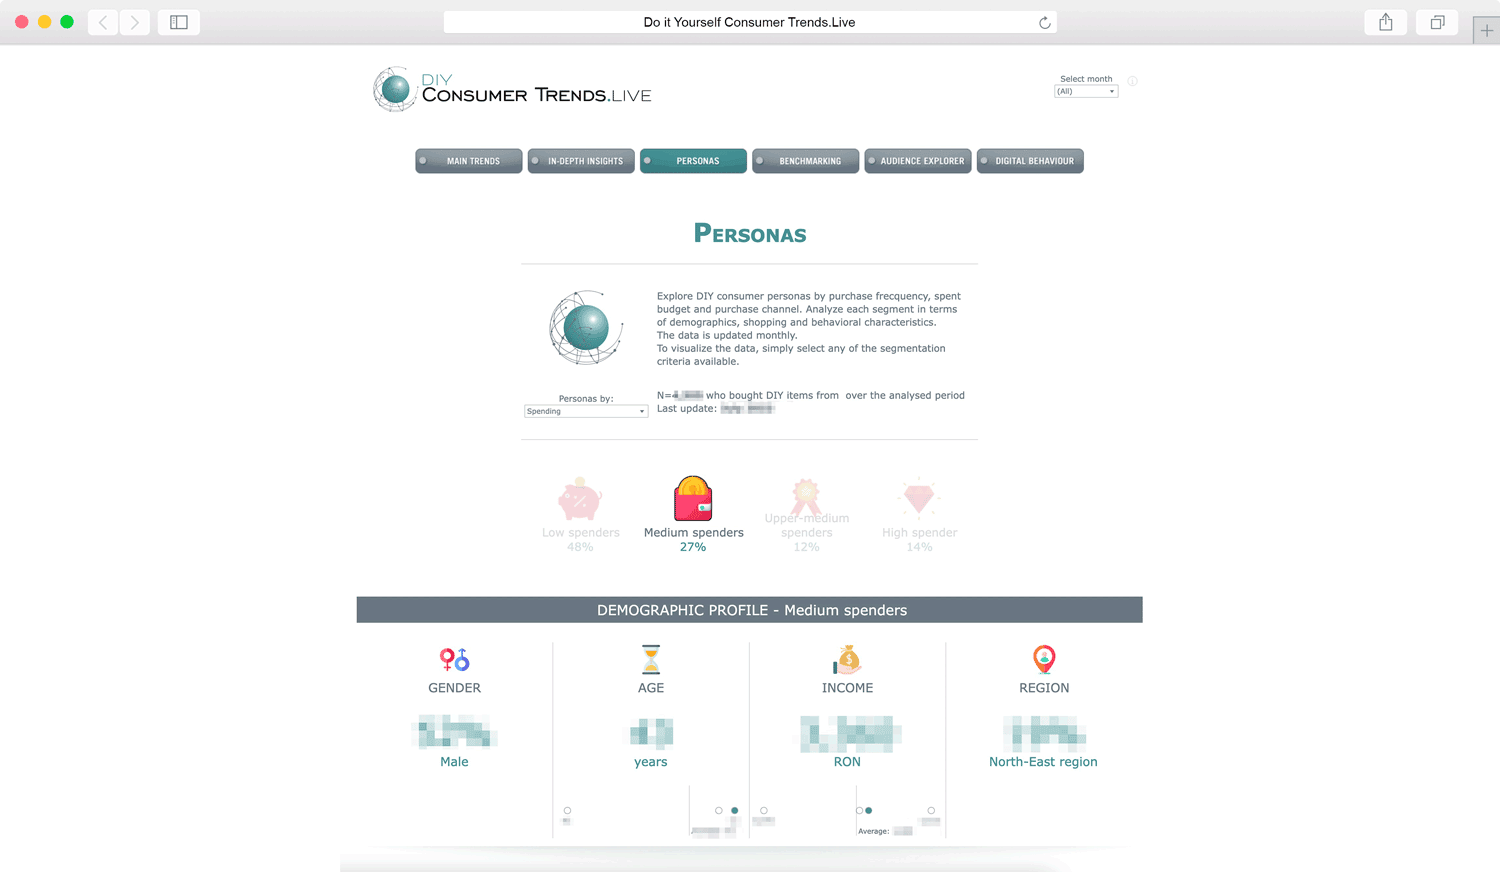
Consumer Personas
Analyze consumer segments in the DIY market, by Purchasing frequency, Budget and Purchasing channel.
How it helps you: Distinguish consumers based on behavior and budget, so you can adapt more easily to their needs and preferences.
Segmentation criteria: Purchasing frequency (3 segments), Budget (4 segments) and Purchasing channels (3 segments)
Visualization: Consumer profile, benchmarking by segments
Sample: Total collected up to date, consisting of data for the entire collection period, representative, completed monthly
Data flow from: May 2021
Analyzed data:
- Category share / total consumers
- Demographic profile (gender, age, income, development region, education, profession, marital status, children)
- Consumer behaviors (budget, purpose, share / category)
- Top brands / segment
- Buying behaviors (online share, returns)
- Shopping style (psychographic profile)
- Digital shopping behavior (shopping phone use, purposes)
- Digital content (apps used)
- Interaction with technology (intensity, type of technologies)
You have access to all this data in any of the Consumer Trends or Full Market Insights subscriptions.
DIY
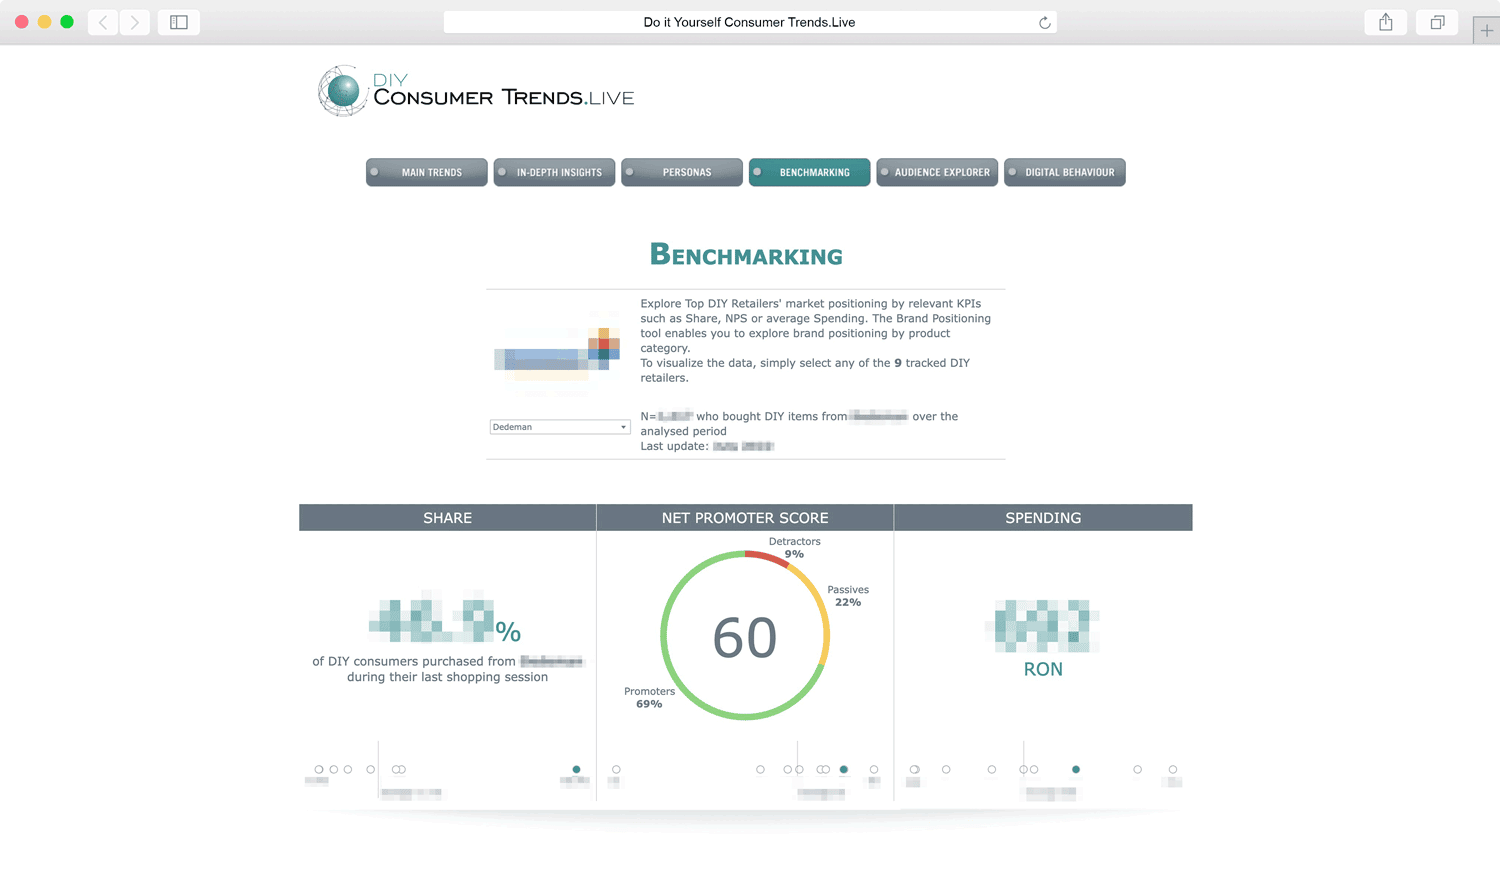
Competitor Benchmarking
Monitor your competition following performance indicators such as Market Share (Consumption), Net Promoter Score, Differentiators.
How it helps you: Whether you’re fighting with the big players, you’re one of them or you’re just getting started, this dashboard will help you to better understand the competitive environment you’re in.
Analyzed Brands: Acaju, Brico Depot, Bricoshop, Dedeman, E-bricolaj, eMAG, Hornbach, IKEA, JYSK, Leroy Merlin, MAM Bricolaj, Mat Haus, O-Mac, Proges, Romstal.
If your brand is not on the list, send us a request and we will consider the opportunity to introduce it in the study.
Visualization: Benchmarking competitors in the Fashion market, Fashion players positioning
Sample: Total collected up to date, consisting of data for the entire collection period, representative, completed monthly
Data flow from: May 2021
Analyzed data:
- Market share / total consumption
- Net Promoter Score (NPS)
- Average budget spent
- Differentiators and vulnerabilities (online / offline)
- Positioning by budget and customer satisfaction (All DIY, Categories)
- Detailed breakdowns by demographics (gender, age, income, education, area of residence, development region)
You have access to all this data in any of the Competitor Benchmarking or Full Market Insights subscriptions.
DIY
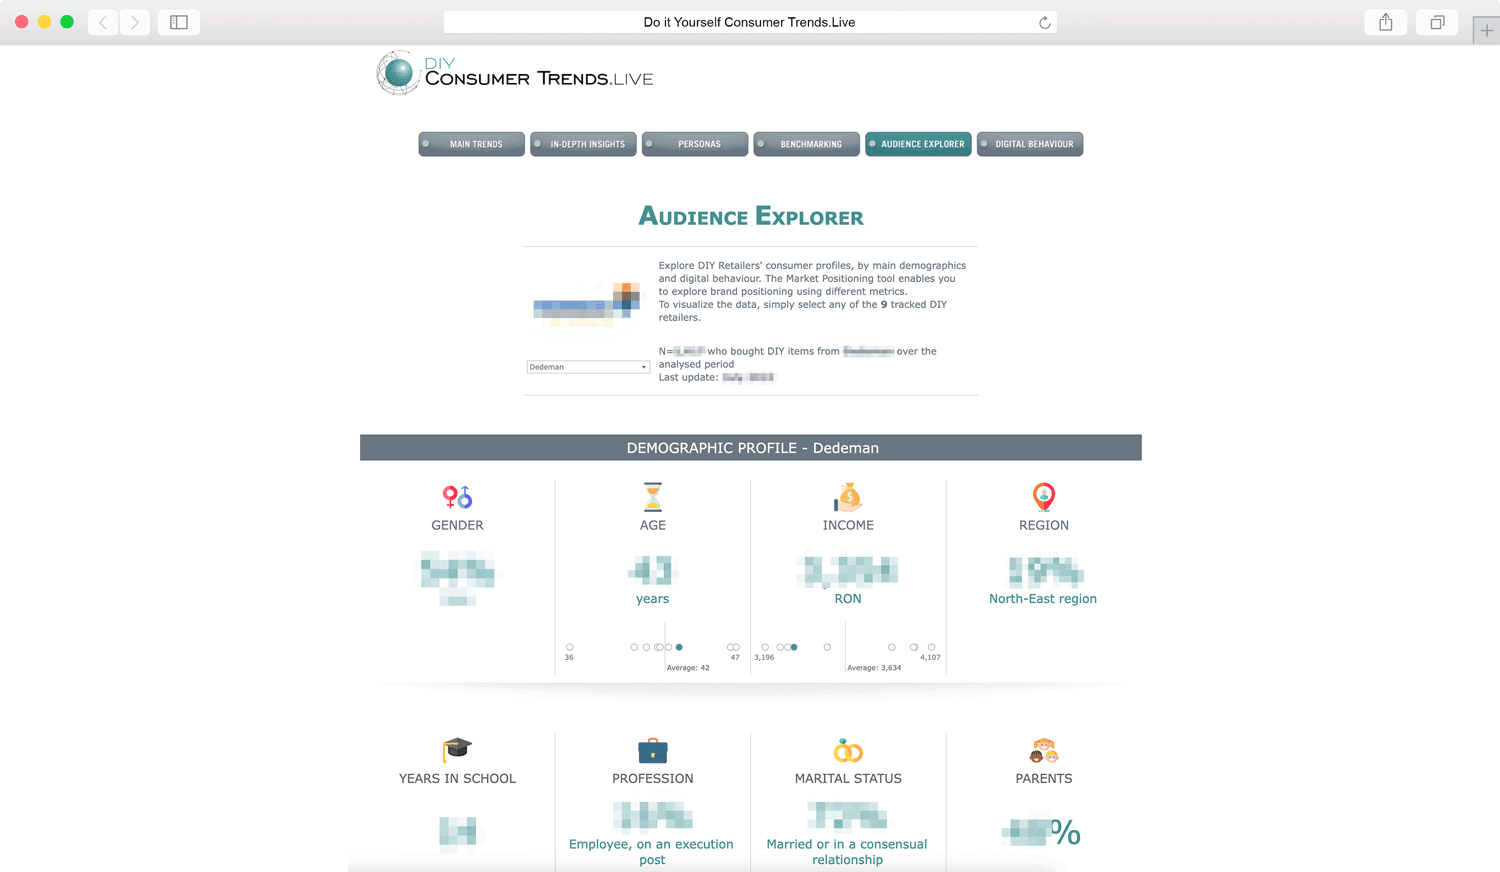
Audience Explorer
Discover your competition through its consumers: find out who they are and what consumer behaviors they have
How it helps you: You discover the key players in the Fashion market from a new perspective: who they are and what their consumers do. Understanding this data can help you make strategic decisions regarding consumer campaigns (for example, ads targeting).
Analyzed Brands: Acaju, Brico Depot, Bricoshop, Dedeman, E-bricolaj, eMAG, Hornbach, IKEA, JYSK, Leroy Merlin, MAM Bricolaj, Mat Haus, O-Mac, Proges, Romstal.
If your brand is not on the list, send us a request and we will consider the opportunity to introduce it in the study.
Visualization: Consumer profile for the main players in the market
Sample: Total collected up to date, consisting of data for the entire collection period, representative, completed monthly
Data flow from: May 2021
Analyzed data:
- Demographic profile (gender, age, income, development region, education, profession, marital status, children)
- Purchasing behaviors (budget, purpose, share / category)
- Top brands
- Buying behaviors (online share, returns)
- Shopping style (psychographic profile)
- Digital shopping behavior (shopping phone use, purposes)
- Digital content (apps used)
- Interaction with technology (intensity, type of technologies)
You have access to all this data in any of the Competitor Benchmarking or Full Market Insights subscriptions.
DIY
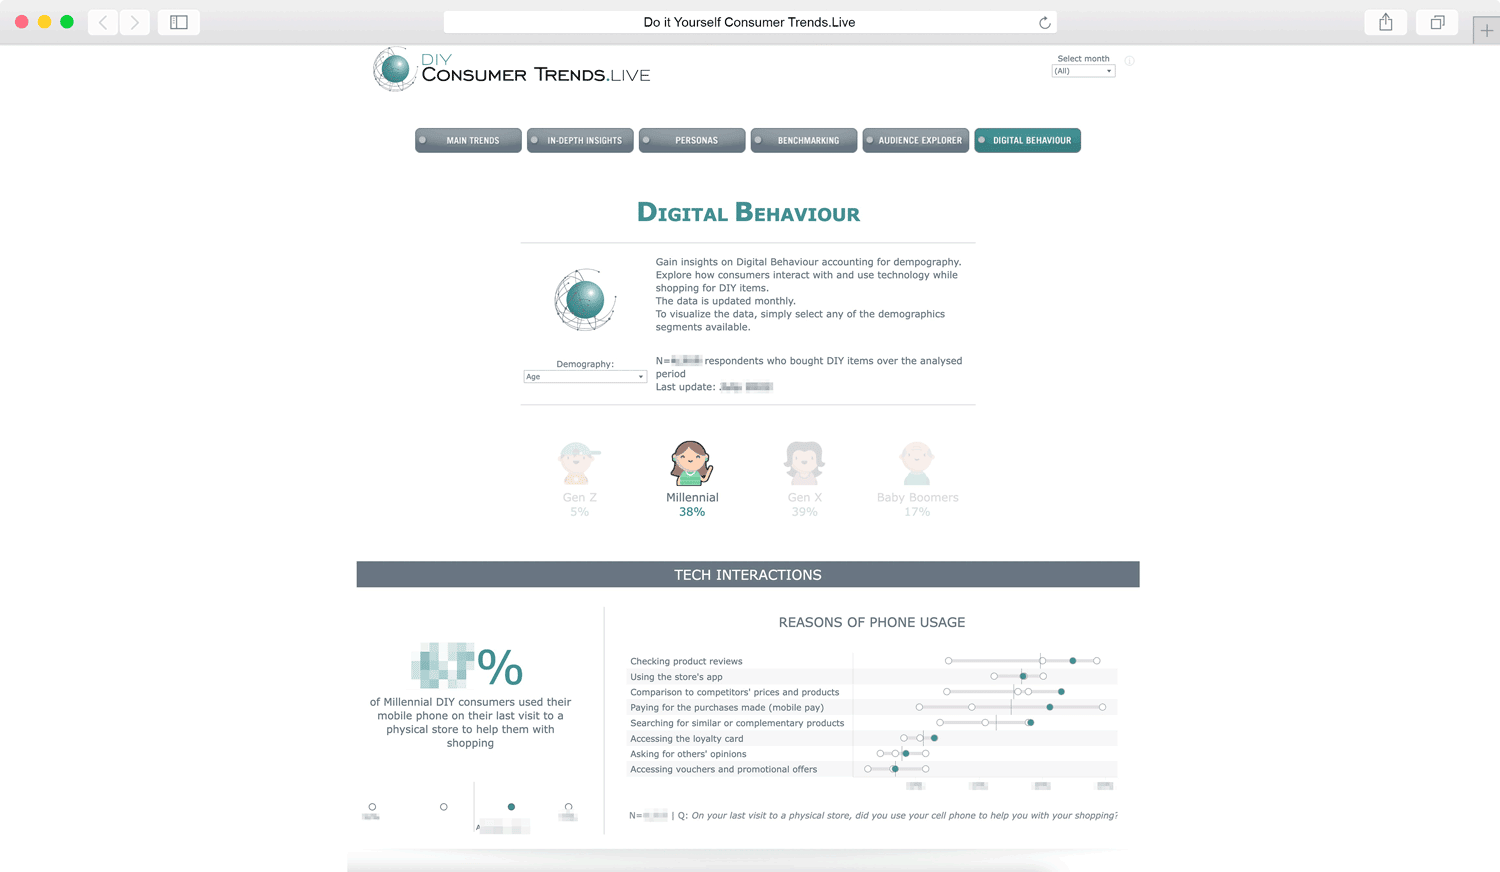
Digital Behavior
DIY shopping digital behaviors
How it helps you: Explore how different consumer segments interact with technology. Use this information to communicate on the right channels and to respond to changing needs.
Segmentation: Gender, age, income, education, profession, area of residence, development region
Visualization: Digital behaviors, comparatively analyzed
Sample: Total collected up to date, consisting of data for the entire collection period, representative, completed monthly
Data flow from: May 2021
Analyzed data:
- Shopping phone usage (intensity, purpose)
- Mobile content (apps)
- Digital technologies (intensity, type of technology)
You have access to all this data in any of the Consumer Trends, Competitor Benchmarking or Full Market Insights subscriptions.
Extra Bonuses:
Yes, the list of cool stuff isn’t over yet
Upon subscription, you receive a welcome gift The Store of the Future Whitepaper, a report on the main trends that define tomorrow’s retail, which we update twice a year.
.Live
Bonus: The Store of Tomorrow
The accelerated digitalisation caused by the COVID-19 pandemic has driven retail’s evolution towards new technologies and brought the Future into the present.
Discover how consumers imagine The Store of Tomorrow, in the current context, and choose to make informed decisions, anchored in the market’s reality, that will help you remain relevant for your target audience.

400+
Guaranteed minimum monthly respondents
17+
Analyzed DIY Retailers
5%
Recurring participants MoM (max)
- Sample: N=400 valid respondents, minimum guaranteed
- Sample features: national representative on the basis of gender, age and region. 95% confidence level, max. Error +/- 5%
- Target: the general population of Romania aged between 18 and 65 years
- Research method: online survey
- Instrument: questionnaire
- Data view: Interactive dashboard, online
- Approach: online, through the MKOR Panel
Loading, please wait...
Explore.Live the DIY Market
.Live
ConsumerTrends
Everything about consumers
in the DIY Market
Statistical representative sample
(minimum 400 / month)
Monthly data update
.Live
Competitor Benchmarking
Everything about the competitors
in the DIY Market
Statistical representative sample
(minimum 400 respondents)
Monthly data update
.Live
Full Market Insights
Everything about consumers
(Consumer Trends)
Everything about competitors
(Competitor Benchmarking)
Everything about the DIY Market
We answer your frequently asked questions
Upon subscription, depending on the type of subscription you have chosen, you will receive instant access to:
- Your Consumer Trends, Competitor Benchmarking or Full Market Insights dashboard
- BONUS: All available historical data for the last 12 months
- BONUS: The Store of Tomorrow whitepaper, a report that contains the main trends that will define tomorrow’s retail, from today’s consumer’s perspective
Yes. We know how important it is to get a clear idea of the service you are going to purchase, so yes, you can request a demo for a dashboard.
One of the MKOR consultants will schedule a demonstration discussion, in which he will present you a live demo dashboard (generated from random data).
Immediately after completing the order form, you will receive an email from us with the proforma invoice.
Once the payment is confirmed, you will receive an email with the tax invoice and the credentials for your Fashion Consumer Trends.Live dashboard.
When you subscribe, you get access to your personalised Consumer Trends.Live dashboard. In it, our experts translate market data into an interactive and easy-to-understand format. We recommend that you save the link to your dashboard to access it quickly, whenever you want.
We have also prepared script and video tutorials, which you can find directly in the dashboard. And if you have gone through the tutorials and still have questions, you can contact us directly. A consultant will help you at any time, from Monday to Friday, between 09:00 and 18:00.
The data you will access by subscribing to Consumer Trends.Live connects you in real time to your market of interest. This will give you an unprecedented competitive advantage because:
- You will know at any time how consumption evolves in the market, depending on category, budget, brands (Consumer Trends)
- You will identify the consumer profile in general, by category, budget or by brand (Consumer Trends)
- You will find out who are the top retailers in the market and their evolution in terms of conversion rate, NPS score or average budget (Competitor Benchmarking)
- You will have access to the main differentiators and weaknesses of the top retailers in the market, according to the opinion of consumers in that niche (Competitor Benchmarking)
- You will have at hand a tool through which you can explore the target audience for your industry of interest, in general, and that of large retailers in the market, in particular (Competitor Benchmarking)
We hope we have answered your question. If you still have doubts about the usefulness of the data, schedule a demo with a consultant >
Yes, of course! If you intend to enter a market that we are already analysing, accessing this study will help you find out the market trends instantly and at a much better price than a personalised study.
Sure it does! We developed Consumer Trends.Live with entrepreneurs like you in mind, to help you have instant access to up-to-date market data in an intuitive and easy-to-explore format – all at a much better price than a custom study.
We know that when you start you do not have thousands of euros to order your own study. But the need for quality, professionally collected and analysed data is essential to substantiate any winning launch strategy.
Find out how the data provided by Consumer Trends.Live can help you in the upper detailed sections or request a demo with one of our consultants>
DIY Consumer Trends.Live monitors 17 DIY retailers: Acaju, Brico Depot, Bricoshop, Dedeman, E-bricolaj, eMAG, Hornbach, IKEA, JYSK, Leroy Merlin, MAM Bricolaj, Mat Haus, O-Mac, Proges, Romstal.
If your brand is not on the list, send us a request on [email protected] and we will analyse the opportunity to introduce it in the study.
For an easier use of the dashboard, we have prepared script and video tutorials, which you can access directly from the dashboard.
If you still have questions after going through the tutorials, you can contact us anytime, from Monday to Friday, between 09:00 – 18:00 and a consultant will help you. You can find us here>
Monthly. At the beginning of each month, MKOR Panel respondents are invited to share their shopping experiences from last month.
Their answers are updated in real time in the dashboard.
Each month, you will receive an automated email notifying you that the data in the dashboard has been updated.
Yes, the sample on which we carry out the research is nationally representative based on gender, age and region.
We make sure you receive statistically significant data, by guaranteeing a minimum number of respondents per month (minimum N = 400), consumers in the field of interest (people who have purchased clothing, footwear or accessories during the last month).
The validation of respondents takes place through a partially automated, partially manual process. This ensures that the data you explore is valid and complete.
To validate his answer, a respondent must:
- Be an adult over the age of 18
- Have purchased clothing, footwear or accessories during the last month (reported at the time of completion of the study)
- Complete the entire questionnaire
- Go through the questionnaire in a time frame that indicates the careful reading of questions and answers (we eliminate the so-called “speedsters”)
- Complete the answers to the questions correctly and honestly (we will eliminate the “straight line” answers or where filling patterns are visible)
Consumer Trends.Live eliminates the huge collection and analysis periods required for a custom or an omnibus study. That’s why, in the .Live platform, you have instant access to data from real consumers, updated monthly.
Compared to the alternatives, Consumer Trends.Live gives you instant access to data and allows you to analyse market behaviour in an intuitive and dynamic interface with a single click. Everything at much more affordable costs.
Specifically, with Consumer Trends.Live you benefit from 20-35x lower costs compared to the custom studies. That is only 3-5% of the amount you would pay if you conducted this study.
Custom Study
| Omnibus Study
| Consumer Trends.Live | |
Cost / Respondent | ≥3.5 € | 1 € - 1.5 € | 0.25 € - 1.25 € |
Cost / Question | n/a | 350€ - 500€ | n/a |
Sample | National representative N=1067 | National representative
N=1000 | National representative
N=400 |
Target Population | Overall population of the country | Overall population of the country | Population showing a certain behaviour in the last month |
Deliverable | Raw Database
Detailed Analysis
Research Report | Raw database
Detailed analysis | Live, dynamic and interactive dashboard |
Deliverable format | Static Excel, .pdf | Static Excel, .pdf | Live, dynamic and interactive dashboard |
Data update | Once | Periodically, depending on the provider | Monthly
|
Access | 6-7 weeks | 4-5 weeks | Instantly |
Invoicing is made automatically upon receipt of your order. Initially, you will receive a proforma invoice, and after we receive the payment, we will send you the tax invoice.
At the end of the 12 months of the subscription, if you opt for the extension of the subscription, the process resumes.
You pay the proforma invoice by bank transfer and send us the proof of payment by email. Manually validating your payment and account can take 2-3 business days.
Because we want the subscription to Consumer Trends.Live to be as easy as possible, we are working on the implementation of the online payment system, via card. We’ll be back with an email update when this option is available.
The subscription is automatically renewed for a period similar to the previous one (12 months).
After renewing your subscription, you retain access to all the historical data you have had access to until then.
If you do not want to renew your subscription, you can cancel it before it expires and explore the data while your access link is still valid. After your subscription expires, you lose access to the dashboard, so you need to make sure that you save the information you will need.
Do not worry, though. 14 days before the subscription expires, you will receive an automatic notification email, in which you will be able to opt for the extension or cancellation of the subscription.
Yes, you can unsubscribe, but you will not be able to request a refund. With the subscription, you receive access to all the historical data (from March 2021), as well as to all the data updated monthly, for one year (12 months).
We invite you to convince yourself of the long-term benefits of Consumer Trends.Live before accessing the package that suits your company in a customised demo!
One of the MKOR consultants will schedule a demo session, in which he will present you a live demo dashboard (generated from random data).
Of course. You have access to the entire data flow available from the beginning of the collection (March 2021).
Keep in touch?
Do you like what you’ve seen so far? It’s just a small part of what we do. Subscribe to the newsletter and stay in touch with us. We still have a lot to show you! 🙂
Stay up to date with market trends, exclusive data and information on topics that interest you. No spam.


